Planning a Quantitative Study
Five interviews can explain why people leave a pricing page, and they can't say how many people share that reason. Imagine a team that redesigns the page around one complaint from an interview, and later learns that only a few customers ever had it.
Learn on the move: press play and turn your commute, walk or drive into time that grows your design career.

That's why quantitative research counts. It measures how many people do something or think something, across enough of them to trust the number.
Counting on a Product People Already Use
The studies in this theme start from a product that already has users. The product records what people do, such as which features they open and where they stop. A survey can reach the same people by email or inside the app.
So a quantitative study can pick its sample from real accounts. A question about people who sent no invoice in their first week can go to exactly those people, and the product data checks their answers.
In This Theme
The Quantitative Research theme follows a study from the plan to the result:
- Planning a Quantitative Study: the question, the method and the sample, before anything is measured,
- Surveys: asking many people the same questions,
- Product Analytics: counting what people do in the product.
Each method module ends with how to read the numbers and show them to the team.
Anatomy of a Quantitative Study
A number without a plan behind it can't settle a decision. Imagine a team that reports "62% of users like reminders" and nobody can say who was asked, what "like" meant or what the team will do with it.
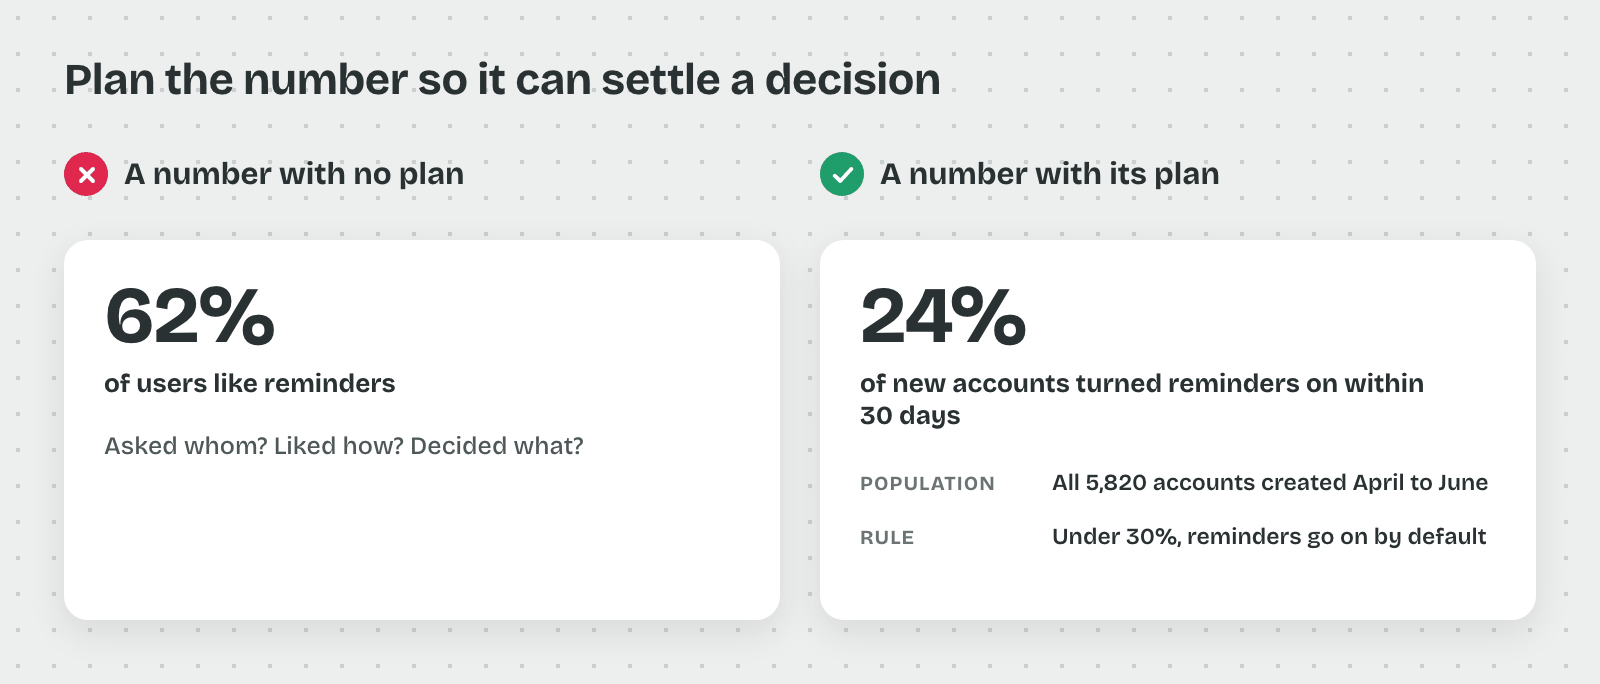
So a quantitative study is planned part by part, before anything is measured.
The Decision and the Question
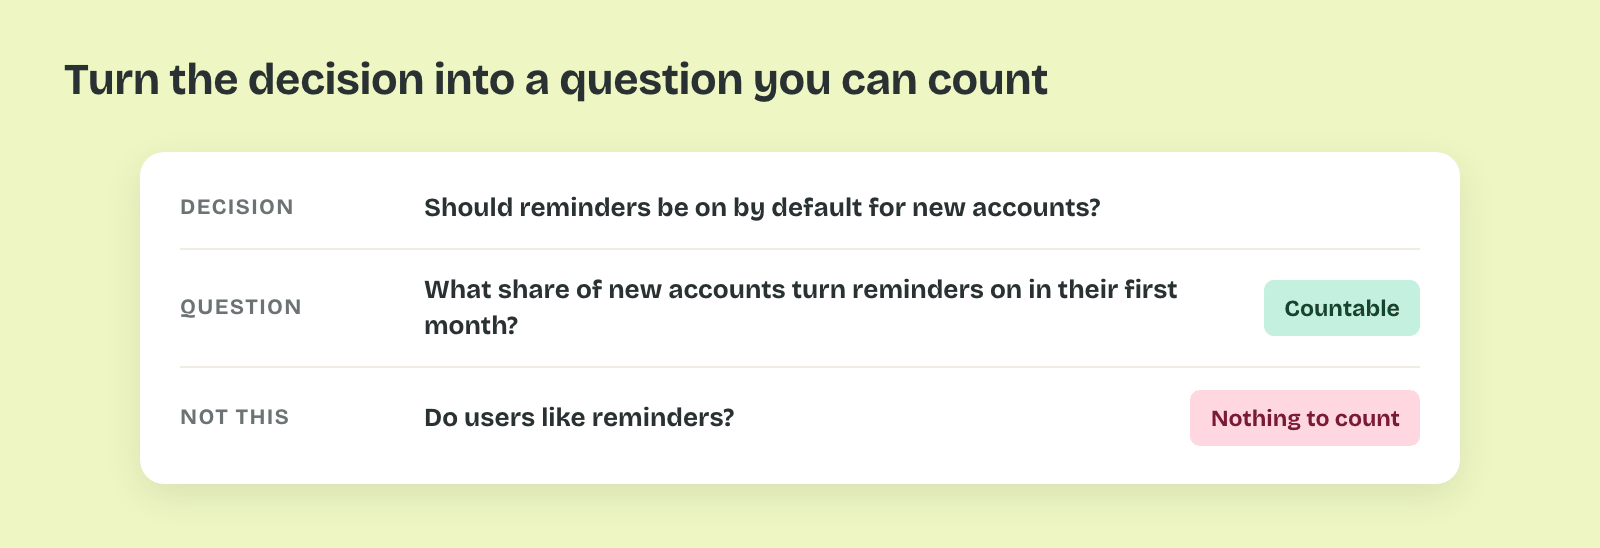
Start from the decision the number will inform. "Should reminders be on by default for new accounts?" is a decision. The research question turns it into something you can count: "What share of new accounts turn reminders on in their first month?"
That's why the question names a measurable outcome and a group of people. "Do users like reminders?" names neither, and any number can be read as a yes.
The Metric and the Population
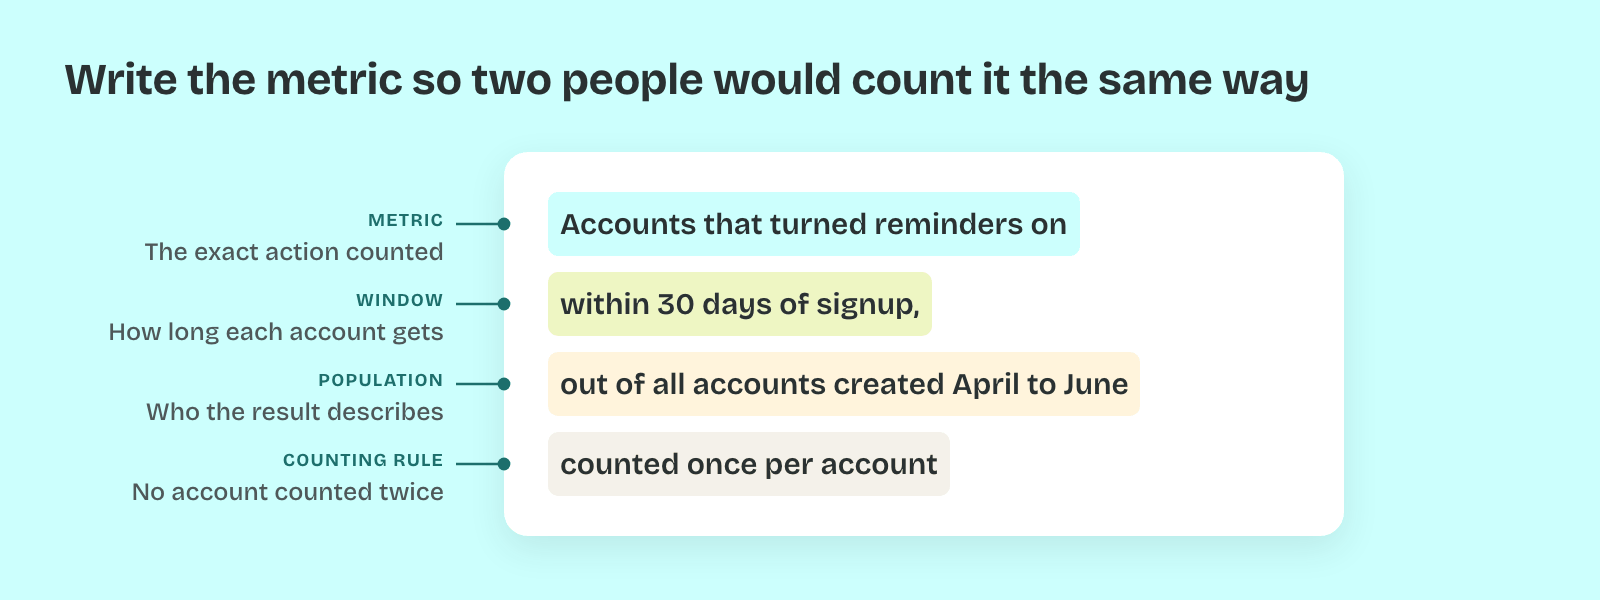
The metric is the exact thing counted, written so two people would count it the same way. "Turned reminders on within 30 days of signup" is a metric. The population is everyone the result should describe, such as every account created this year.
Thus the metric and the population set the limits of the finding. A result about accounts created this year says nothing certain about the customers who signed up five years ago.
The Sample and the Instrument
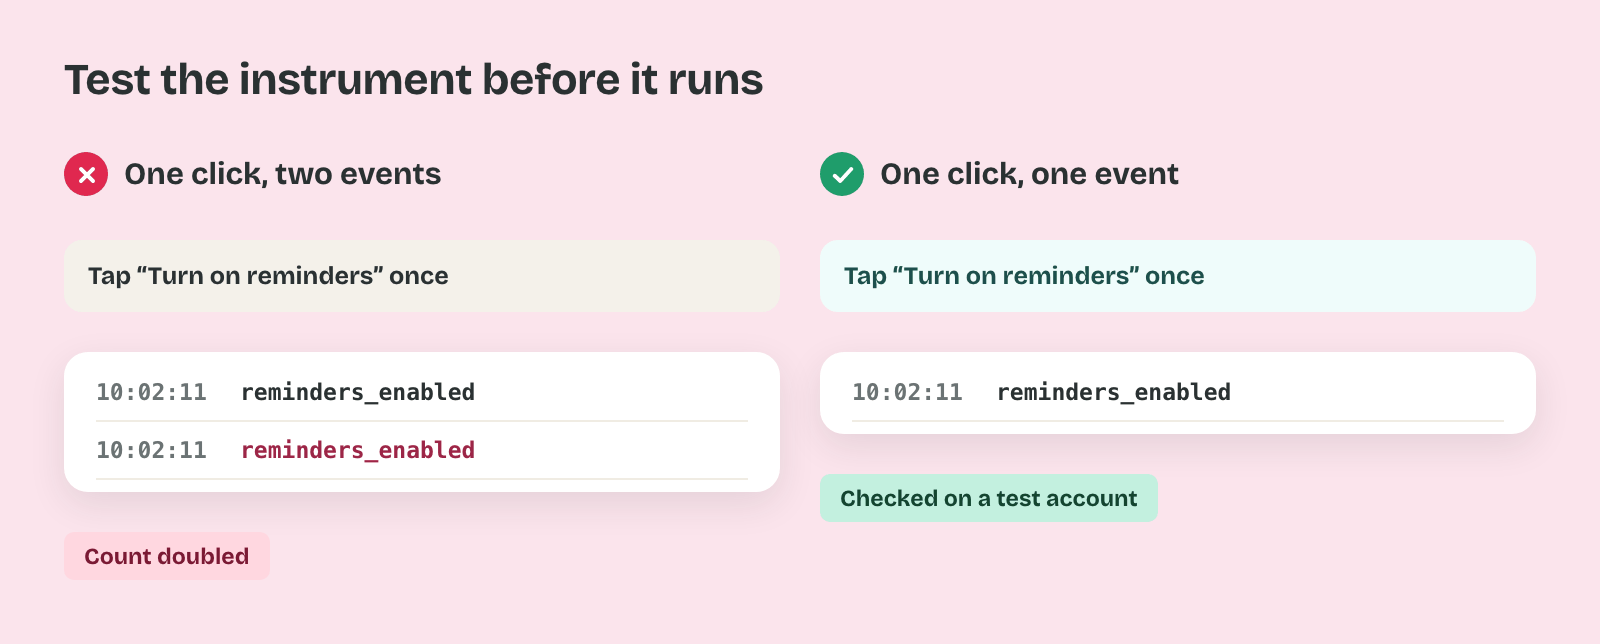
The sample is the part of the population you measure. Product analytics often covers every account, while a survey reaches only the people who answer. The instrument is the tool that records the data, such as a tracked event or a questionnaire.
So the instrument is tested before it runs. An event that fires twice per click doubles the count, and a question that two people read differently splits the answers.
The Analysis and the Output
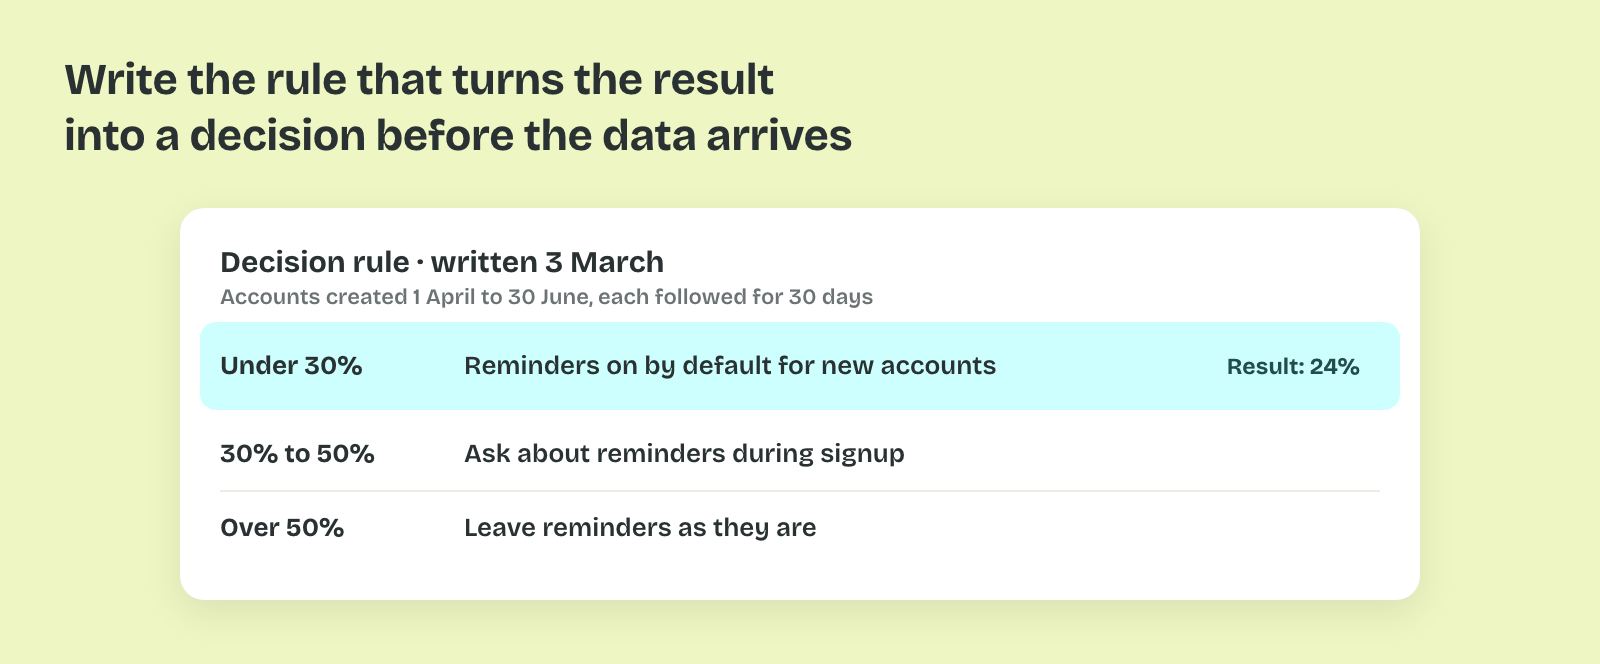
Decide the analysis before the data arrives, such as a share, an average or a comparison between two groups. Write down which result would change the decision. "If fewer than 30% turn reminders on, we switch them on by default" is a rule set in advance.
That's because a rule written afterward tends to fit whatever the data shows. The output is the number with its margin of error, the sample it came from and the decision it supports.
Pro tip: Write the result slide before you collect any data, with the number left blank. If you can't say what the slide would recommend for a high or a low number, the question needs more work.