Product Analytics
The product already records what people do, and a careless reading of that record can send a team after the wrong problem. Imagine a dashboard where sent invoices fall by a third overnight, and a week of redesign work starts before anyone notices the tracking broke in that day's release.
Learn on the move: press play and turn your commute, walk or drive into time that grows your design career.

That's why product analytics is read with the same care as a survey. Each number has a definition, a time window and a group of people behind it.
One Flow in the Invoicing App
The lessons follow the first-invoice flow of an invoicing app used by about 20,000 small businesses. A new account signs up, creates an invoice, adds a client and sends the invoice.
So the module works with the 2,000 accounts that signed up in May. 820 of them sent an invoice within seven days, and the lessons look for where the other 1,180 stopped.
Events, Funnels and Cohorts
A dashboard number means little until you know what it counts. Imagine a chart of 12,400 "active users" where nobody on the team can say whether active means logged in, opened an invoice or sent one.
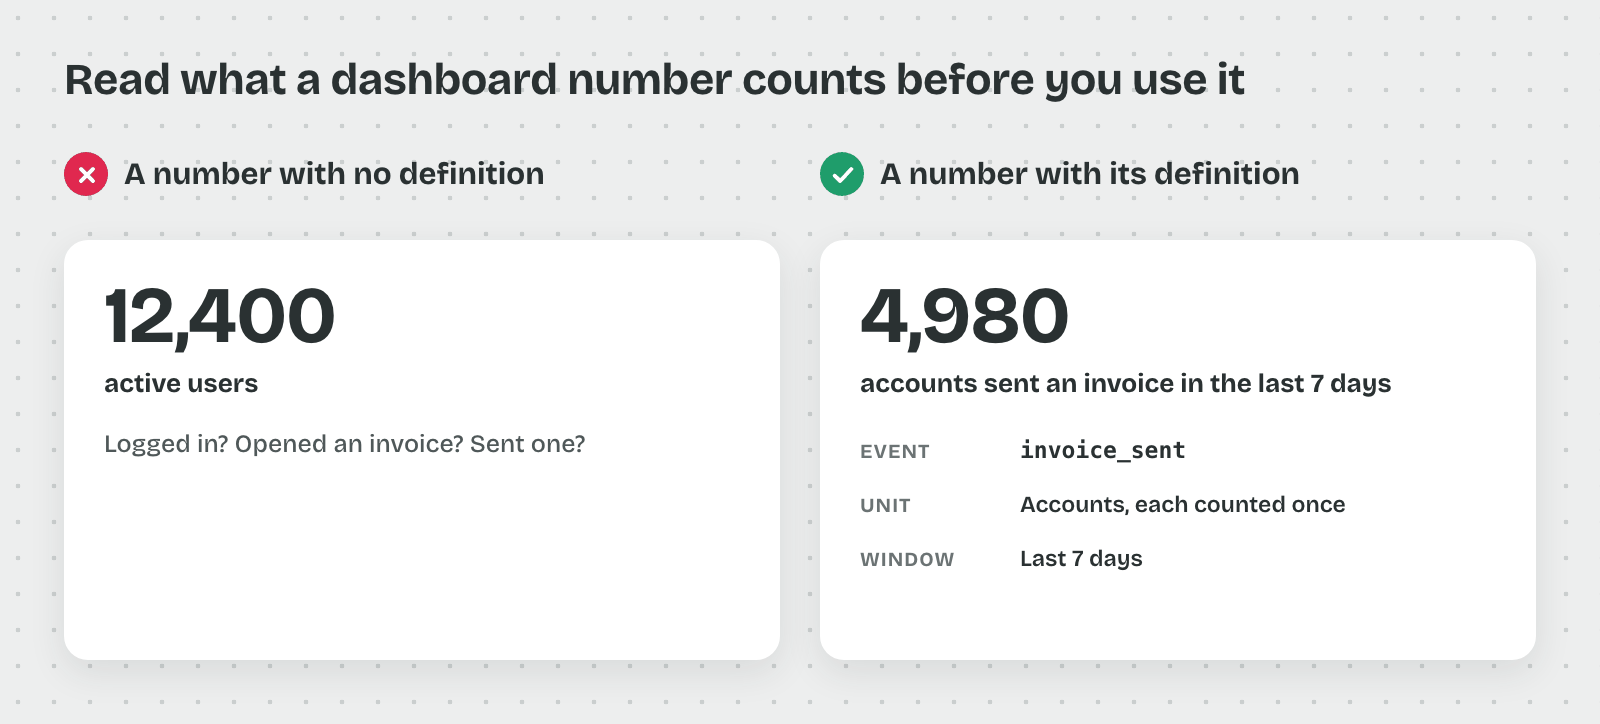
So product data is read through its named parts, starting with the smallest one.
The Event and Its Properties
An event is one recorded action, such as invoice_sent, with the time it happened and the account that did it. Properties are the details stored with the event, such as the device, the plan type or the invoice amount.
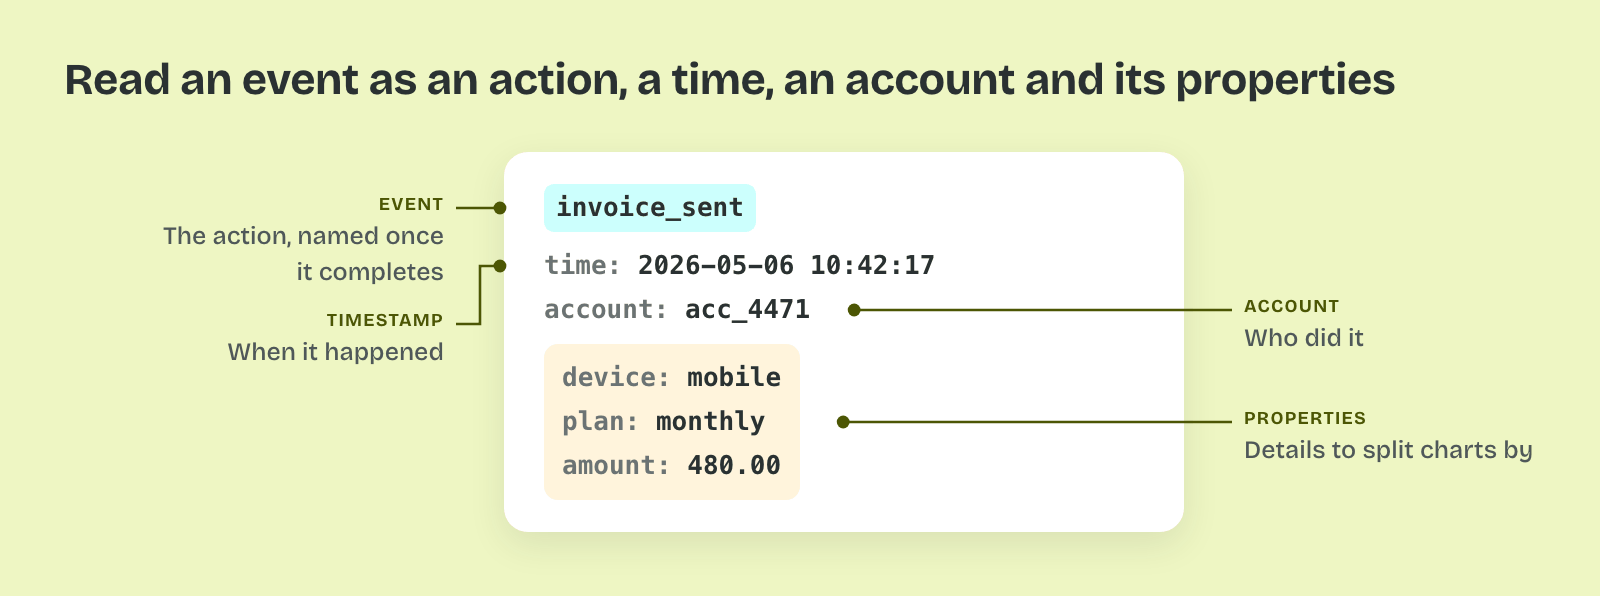
That's why every chart is built from events and split by properties. "Invoices sent on mobile last week" counts invoice_sent events whose device property is mobile.
The User and the Account
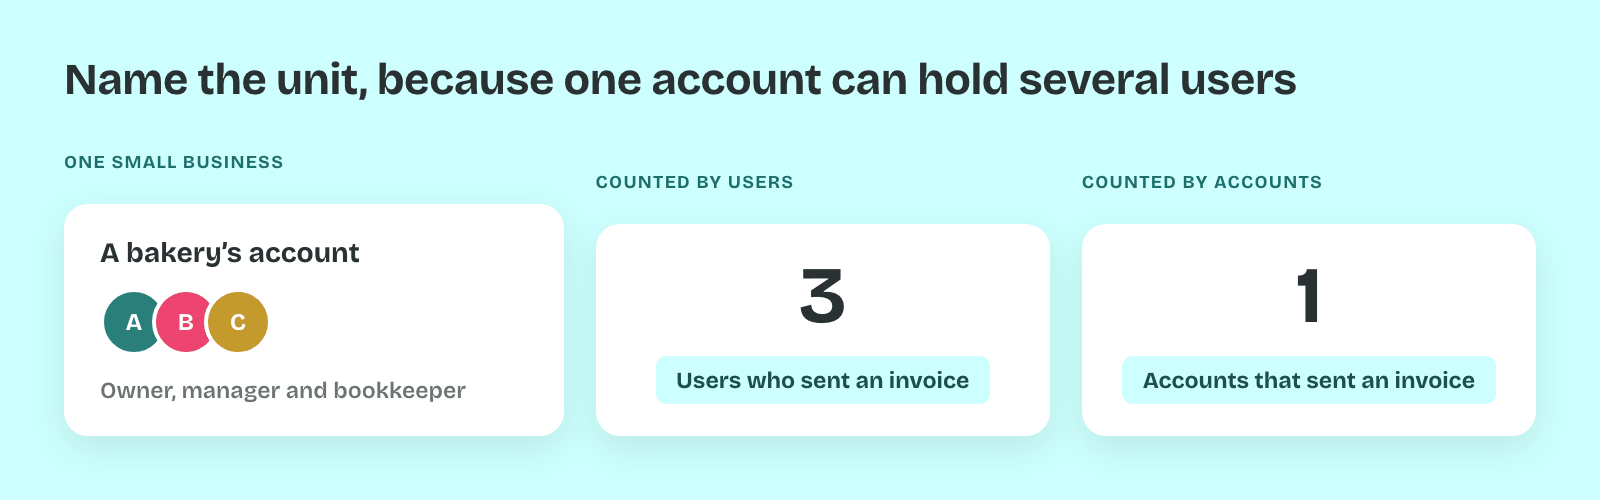
Analytics tools count either people or accounts, and the two differ. One small business can have three people on one account. A count of users can grow while the number of paying businesses stays flat.
So each metric names its unit. "Accounts that sent an invoice" and "users who sent an invoice" answer different questions, and a chart that mixes them can't be compared week to week.
The Funnel
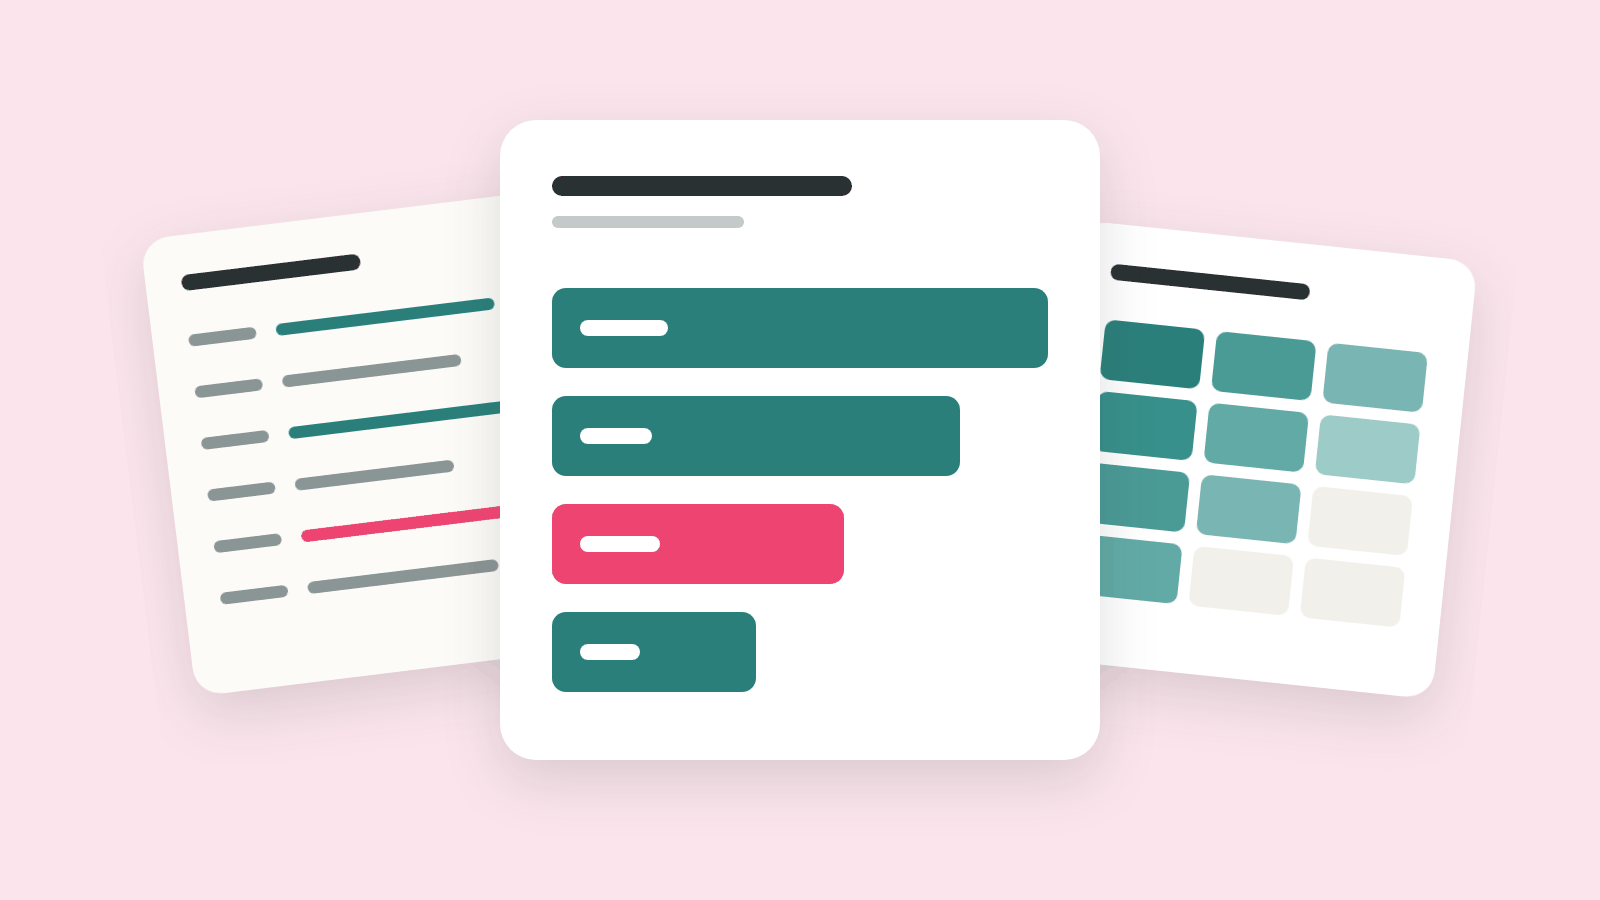
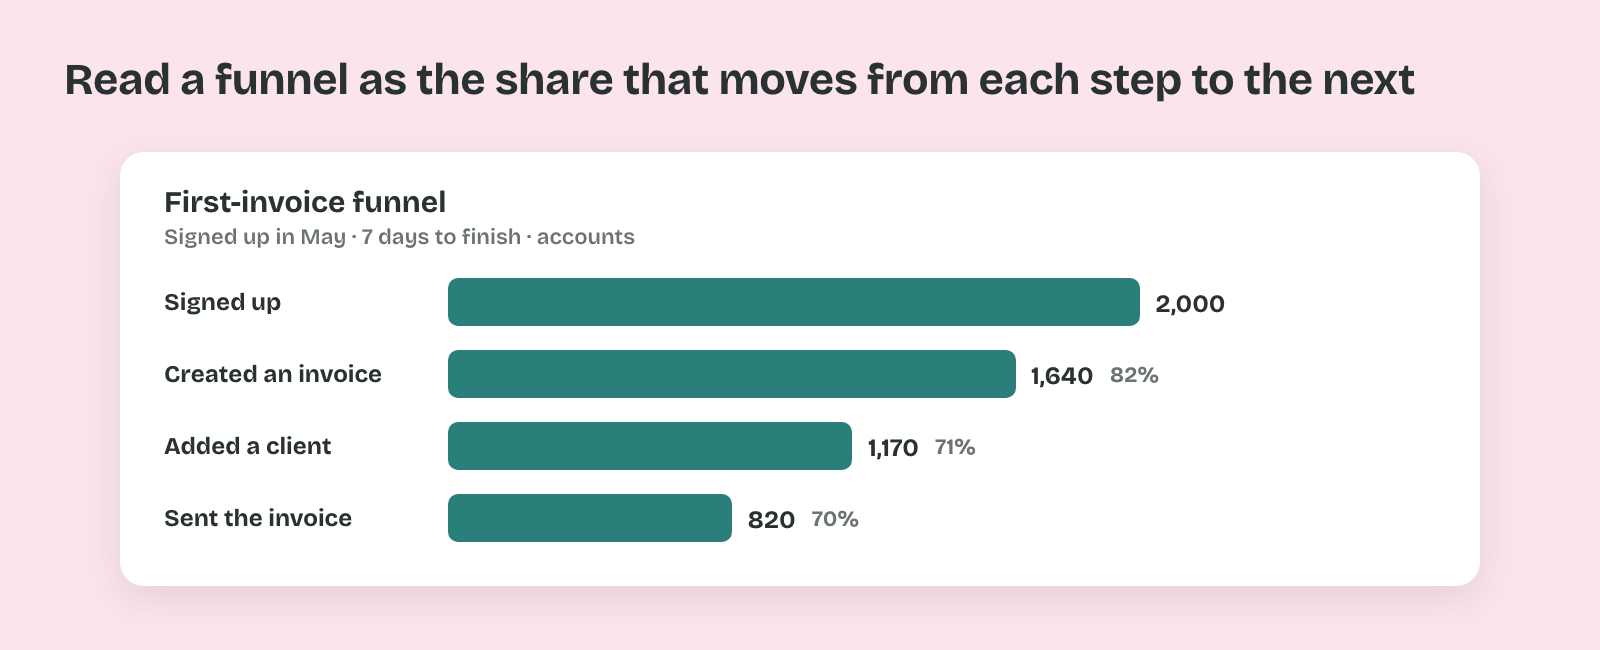
A funnel counts how many accounts complete a set of steps in order, within a time window. In the invoicing app, 2,000 accounts signed up in May. 1,640 created an invoice, 1,170 added a client and 820 sent the invoice within seven days.
Thus a funnel shows where people stop. The step conversion is the share that moves from one step to the next, such as 1,170 of 1,640, or 71%.
The Cohort
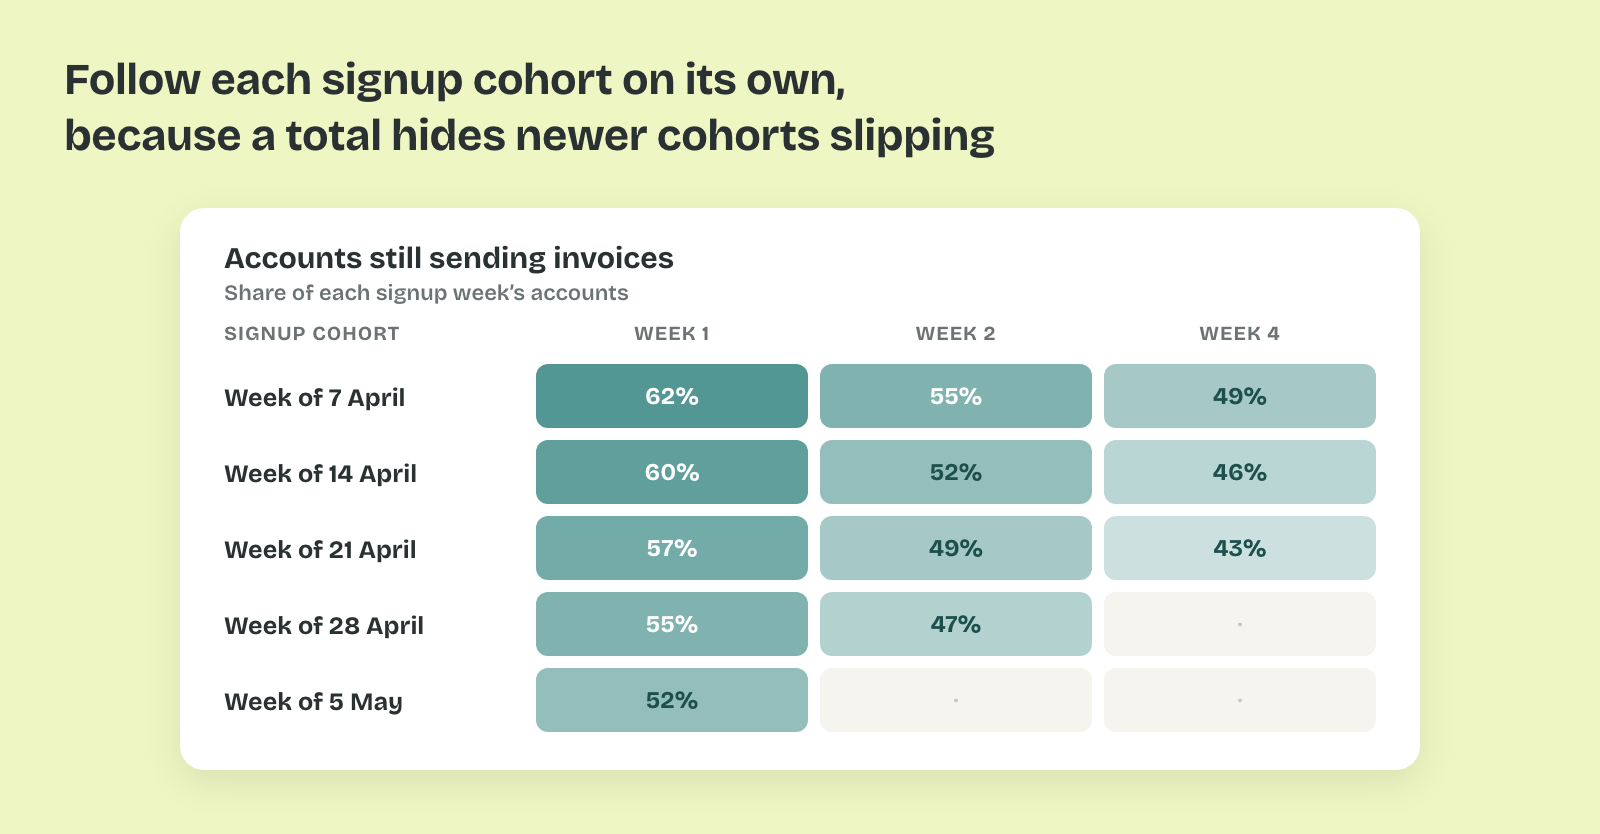
A cohort is a group of accounts that share a starting point, such as the week they signed up. A retention chart follows each cohort over time and shows what share is still active after one, two or four weeks.
That matters because a total mixes old and new accounts. A rising count of sent invoices can hide that each new cohort sends less than the one before, while older accounts keep the total up.
Pro tip: Before you trust any chart, open its definition and read the event, the unit and the window. Write them under the chart when you share it.