Competitive Benchmarking
Ask how your checkout compares with a rival's, and in many teams you'll get three answers. A designer says theirs looks cleaner. A PM says ours has fewer steps. Support says customers keep mentioning the rival's saved cards.
Learn on the move: press play and turn your commute, walk or drive into time that grows your design career.

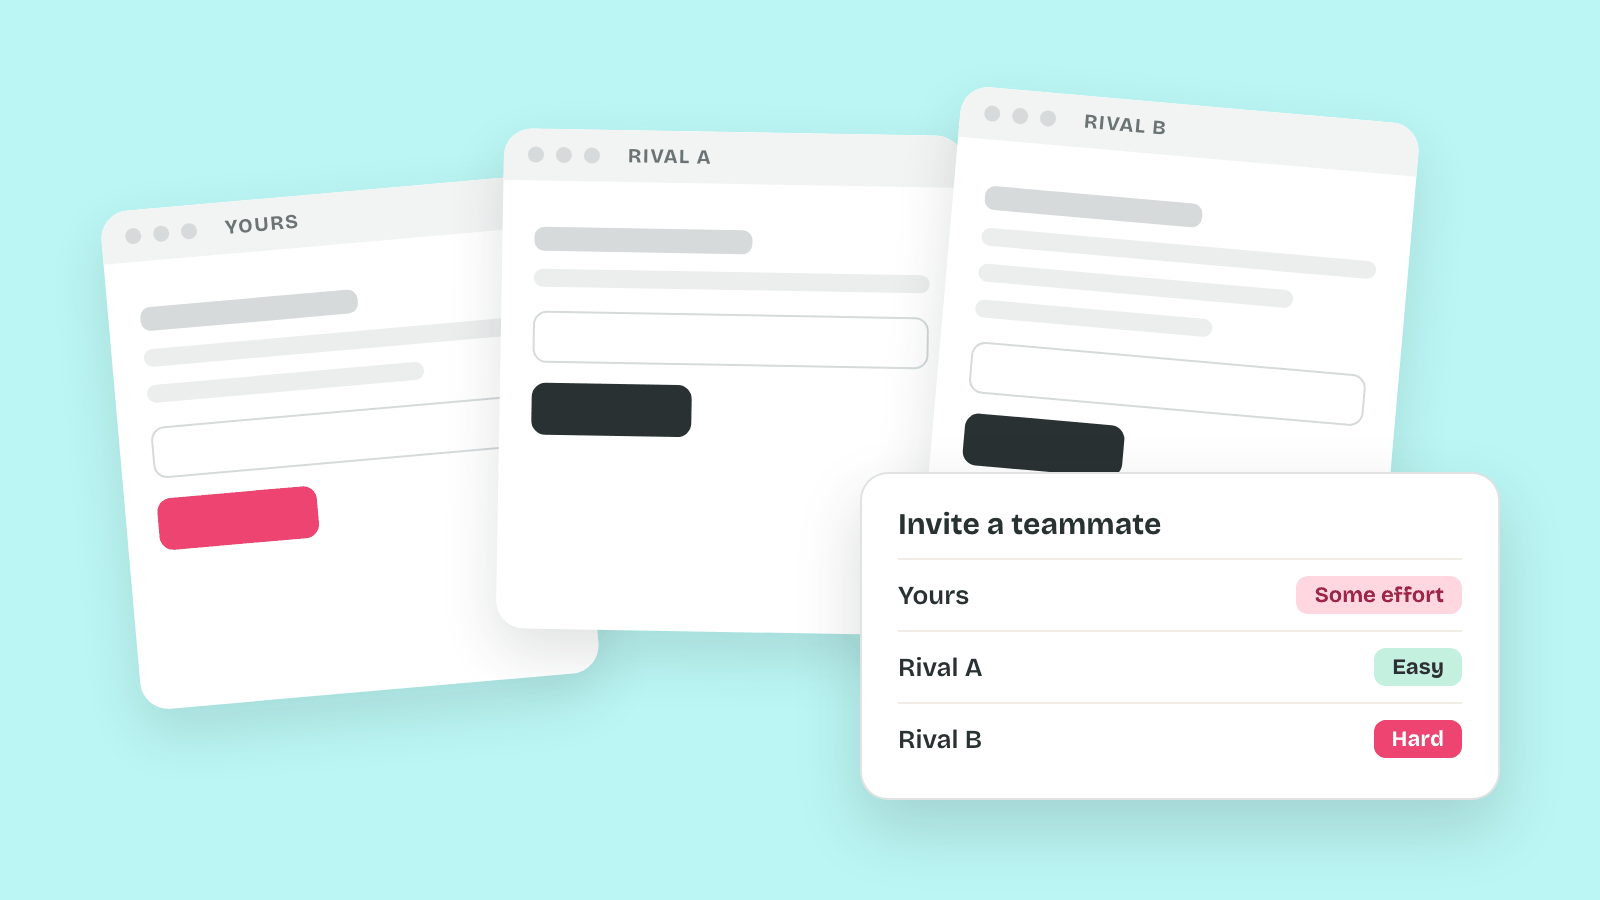
All three can be true, and none of them is a number anyone can check again next quarter. So the argument restarts every planning cycle, and the loudest opinion usually sets the roadmap.
A competitive benchmark turns that argument into a measurement. It runs the same task through your product and a few rivals and records the same numbers for each. Repeat the run, and you can see where you stand and whether you moved.
Why Rivals Set the Bar
Your users judge your product against the others they use. Jakob Nielsen put it in 2000: "users spend most of their time on other sites." So a checkout can feel slow next to a rival's even when nothing in it changed.
That's why the comparison has to stay the same from run to run. Otherwise a gap that looks real is only a change in method.
Anatomy of a Competitive Benchmark
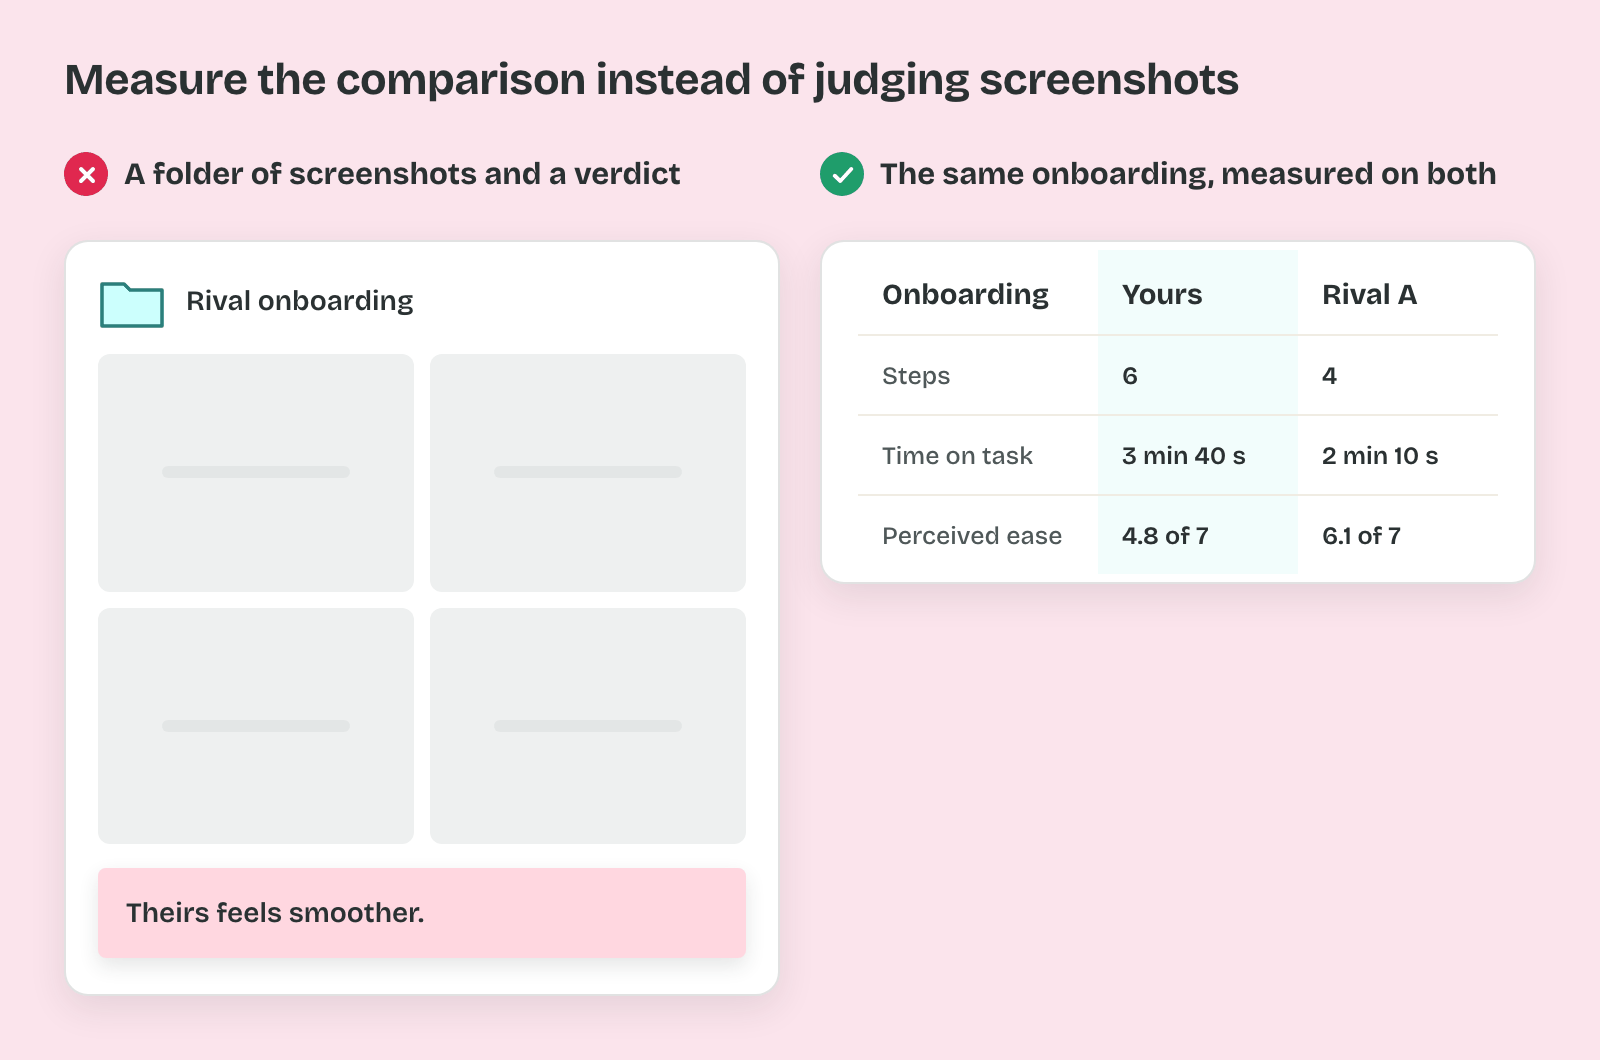
Ask a team to benchmark a rival's onboarding and you'll often get a folder of screenshots back. The verdict is one line: theirs feels smoother. Nobody can say by how much, or what to change. A month later the same exercise gives a different verdict, because nothing in it stayed the same. A benchmark becomes evidence once its parts are named and held still.
The Competitor Set
The competitor set is the list of products you put side by side.
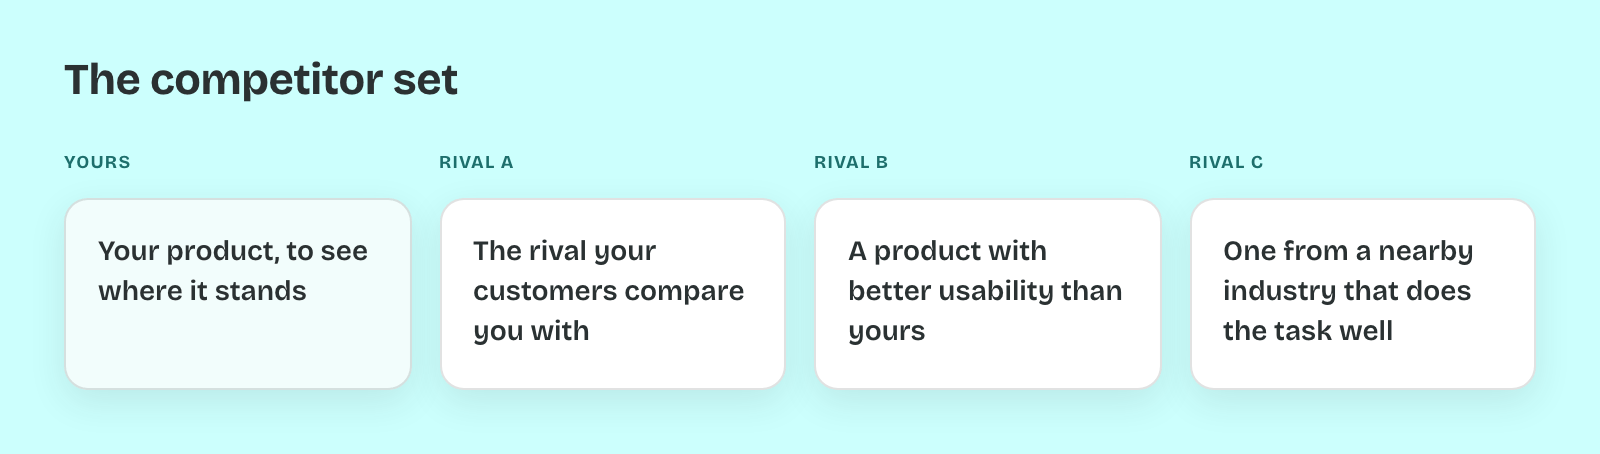
That set should stay small. Tim Neusesser at Nielsen Norman Group puts a typical competitive evaluation at 2 to 4 competitors. Your own product joins them, since the point is to see where it stands.
So pick each one on purpose. Take the rival your customers compare you with. Add one product with better usability than yours. Then add one from a nearby industry that does the same task well.
The Task
The task is the single job every product in the set is asked to do.
In practice that means four fixed things. The persona says who is doing it. The goal says what done looks like, such as inviting a teammate to a project. The start is the screen where the clock begins. Often that's a logged-out homepage. The end is the screen that proves the goal was met.
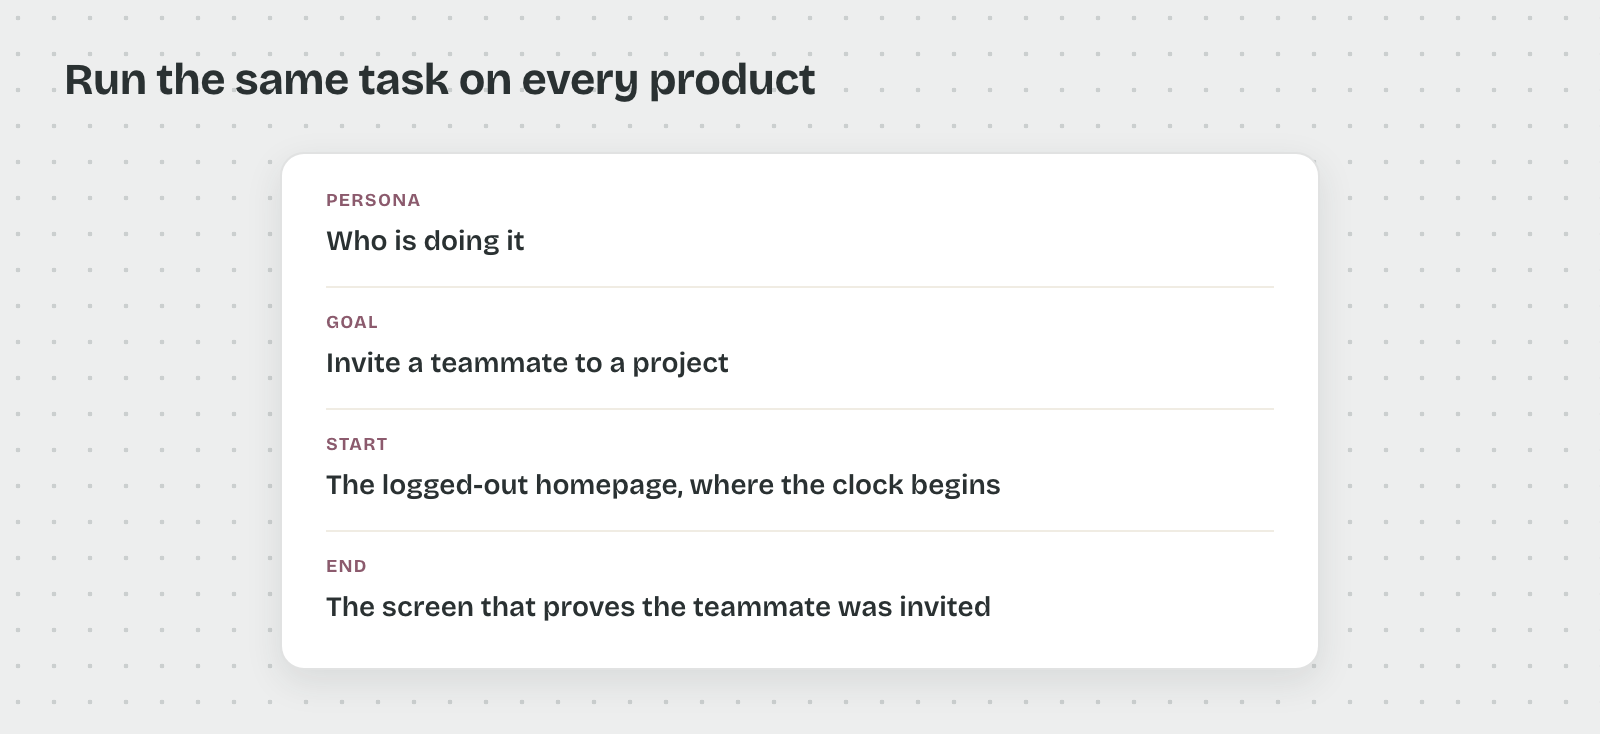
That's because a task with a loose end gets measured differently on every product. Pick one that all of them support, or the comparison has a blank column.
The Measures
The measures are the numbers you record for each product on that task.
Each one answers a different question. Task success records whether the goal was reached. Time on task runs from the start screen to the end screen. Steps count every screen and decision in between. Perceived ease is a rating asked right after the task. The usual one is the Single Ease Question, on a 7-point scale. Jeff Sauro at MeasuringU reports average scores of about 5.3 to 5.6.
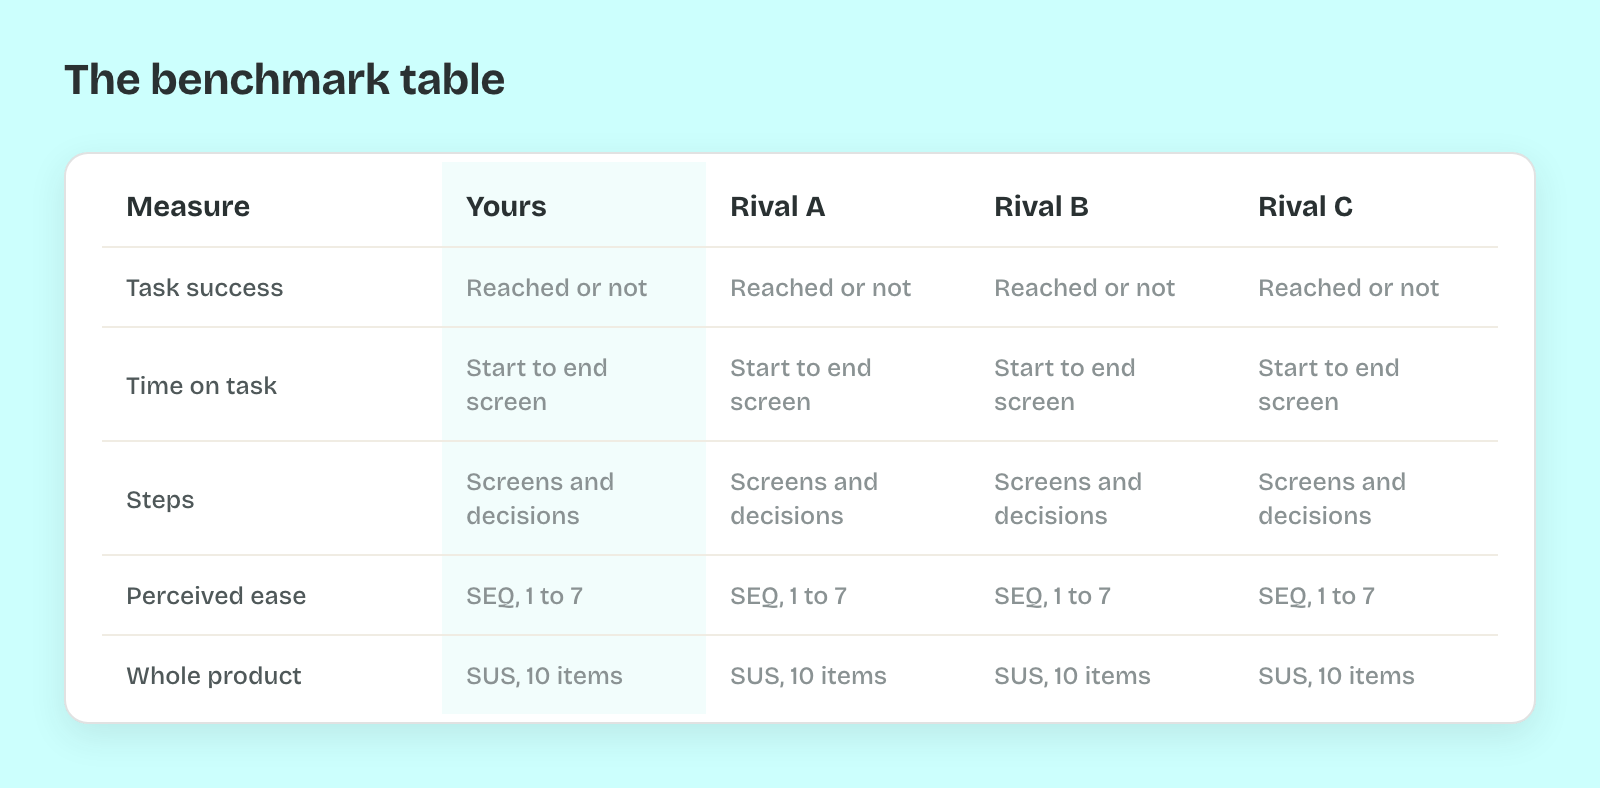
So add one rating for the whole product when you test with people. The System Usability Scale has 10 items, and MeasuringU puts the average at 68 across 500 studies. A score near 68 is ordinary. Well above it is a strength worth studying.
The Sample
The sample is who produces the numbers.
That choice comes down to two methods. An expert review is you or a colleague walking the task on every product. It is fast, and good for steps and friction. A competitive test puts the task in front of real users. Neusesser advises giving each participant only 2 or 3 products. Vary the order too, since people learn the task as they go.
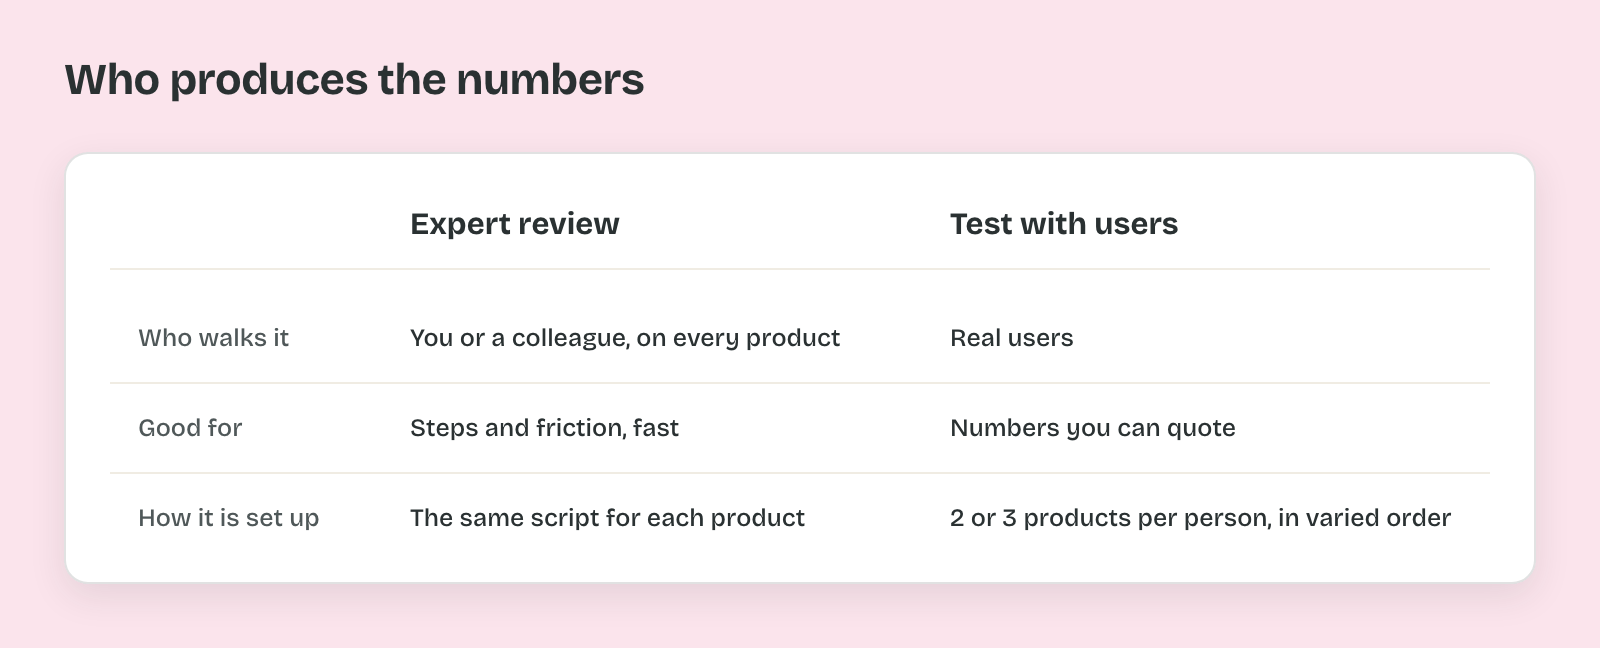
That matters most when you want to quote a number. Raluca Budiu and Kate Moran at Nielsen Norman Group recommend 40 participants for a quantitative study. By their calculation that gives about a 15% margin of error at 95% confidence. With five people you get reasons, which are useful, and a percentage you shouldn't present.
The Baseline
The baseline is what you compare against.
That comparison has four options in Alita Kendrick's guide at Nielsen Norman Group. You can compare with an earlier version of your product, a competitor, an industry benchmark, or a goal stakeholders agreed on. Teams often run it once against a competitor and stop there. Then the first run shows where they stand, and nothing about whether they moved.
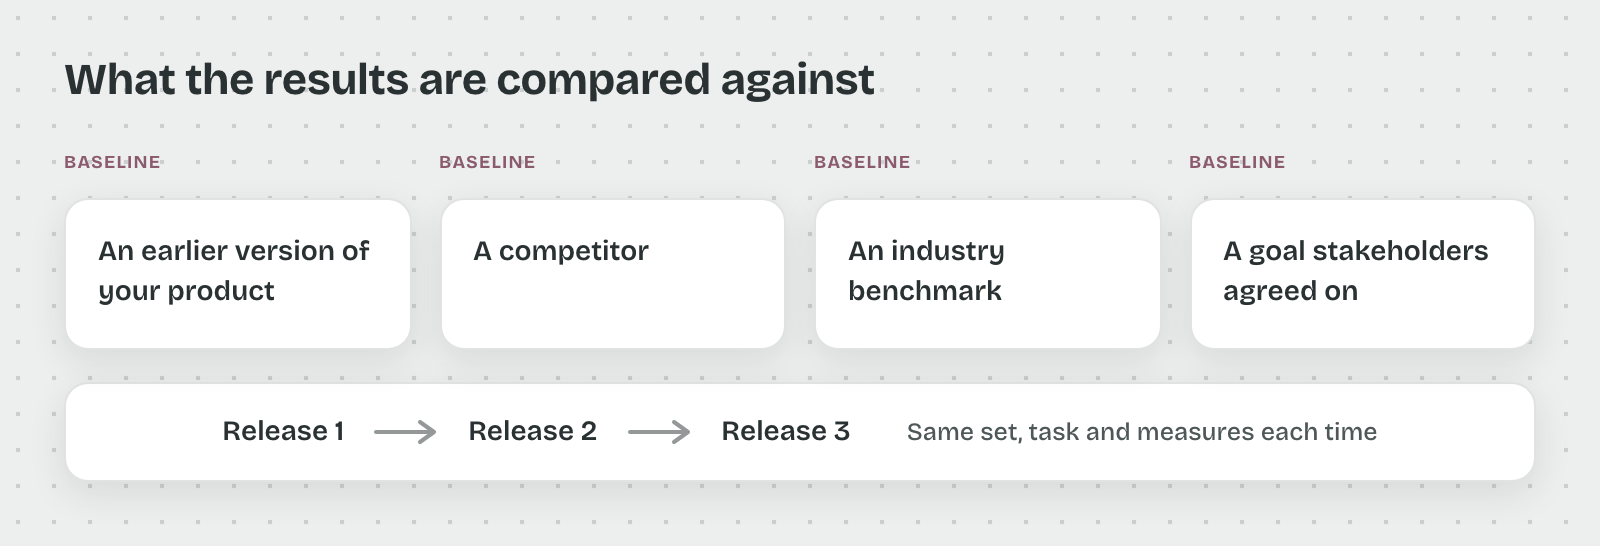
So keep the set, the task and the measures the same and rerun them each release. Then the competitor row and your own last result become two baselines in one table. A drop in your own row can show up before a customer mentions it.
Pro tip: Before opening any competitor, write the task's start and end screens on one line. If two people on the team would draw a different end screen, the benchmark will measure that disagreement instead of the products.