
Customer Journey Mapping
Ask three teams how onboarding is going, and in many companies you'll get three confident answers. Marketing shows signups climbing. Product says the setup wizard tested well. Support has a queue of "how do I invite my team?" tickets, and most of them arrive on day three.
Learn on the move: press play and turn your commute, walk or drive into time that grows your design career.

Yet all three answers can be true while none of them describes what the customer went through. Each team measures its own stretch of the experience. The moment the trouble starts, somewhere between the wizard's last screen and the first real task, belongs to nobody.
That gap is what a customer journey map closes. It draws the whole experience from one person's side, stage by stage. It shows what they do, think and feel, and where each moment touches your company.
What a Map Changes
Customers rate the whole trip, which is why the stretches matter less than the line that joins them. Alex Rawson, Ewan Duncan and Conor Jones of McKinsey reported in Harvard Business Review in 2013 that satisfaction with whole journeys predicted overall satisfaction better than satisfaction with single touchpoints.
So a product can score well at every touchpoint and still lose people in the gaps between them.
That's why the value of a map shows up in the room. Marketing, product and support get one shared picture to argue over. Every problem on it gets a team's name beside it, so somebody owns the day-three tickets.
Anatomy of a Journey Map
Pin a finished journey map to a meeting room wall and it can look like a crowded spreadsheet with a wavy line through the middle. People nod at it, and then nobody knows where to start reading.
Yet a well-made map has a fixed reading order. Kate Kaplan's breakdown for Nielsen Norman Group (2016) splits it into three zones, read top to bottom: the lens, the experience and the output. Sarah Gibbons' Journey Mapping 101 (NN/g, 2018) names five components that sit across those zones. Learn the parts once and every map you meet reads the same way.
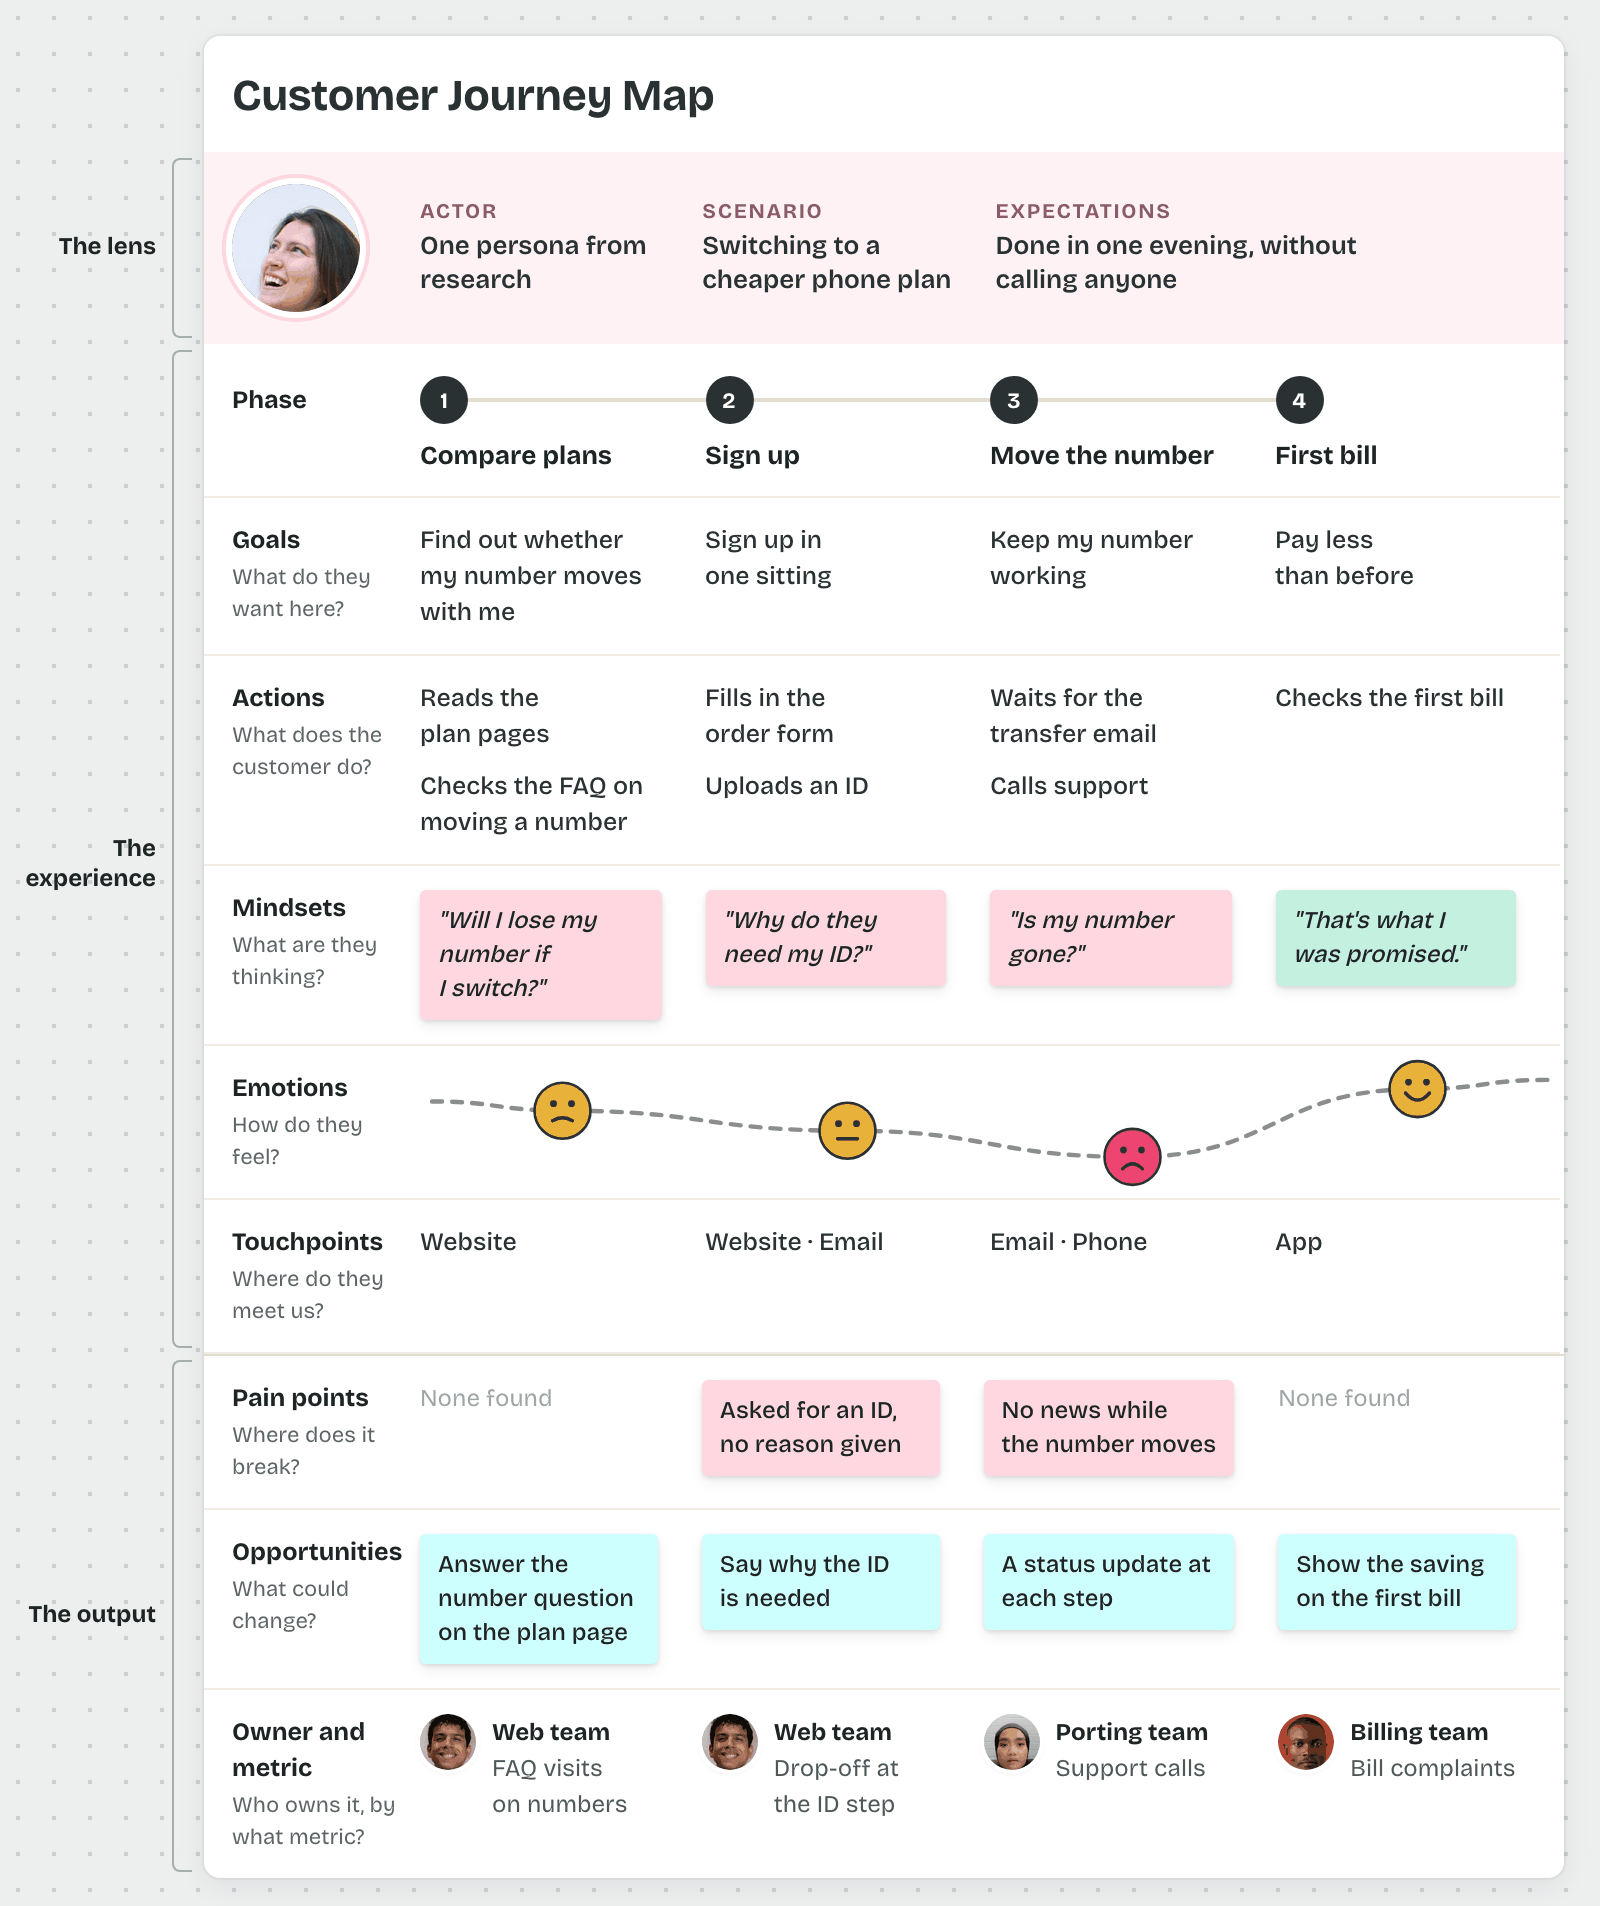
The Lens
The top zone says whose experience this is and which one. It holds two parts, and everything below depends on them.
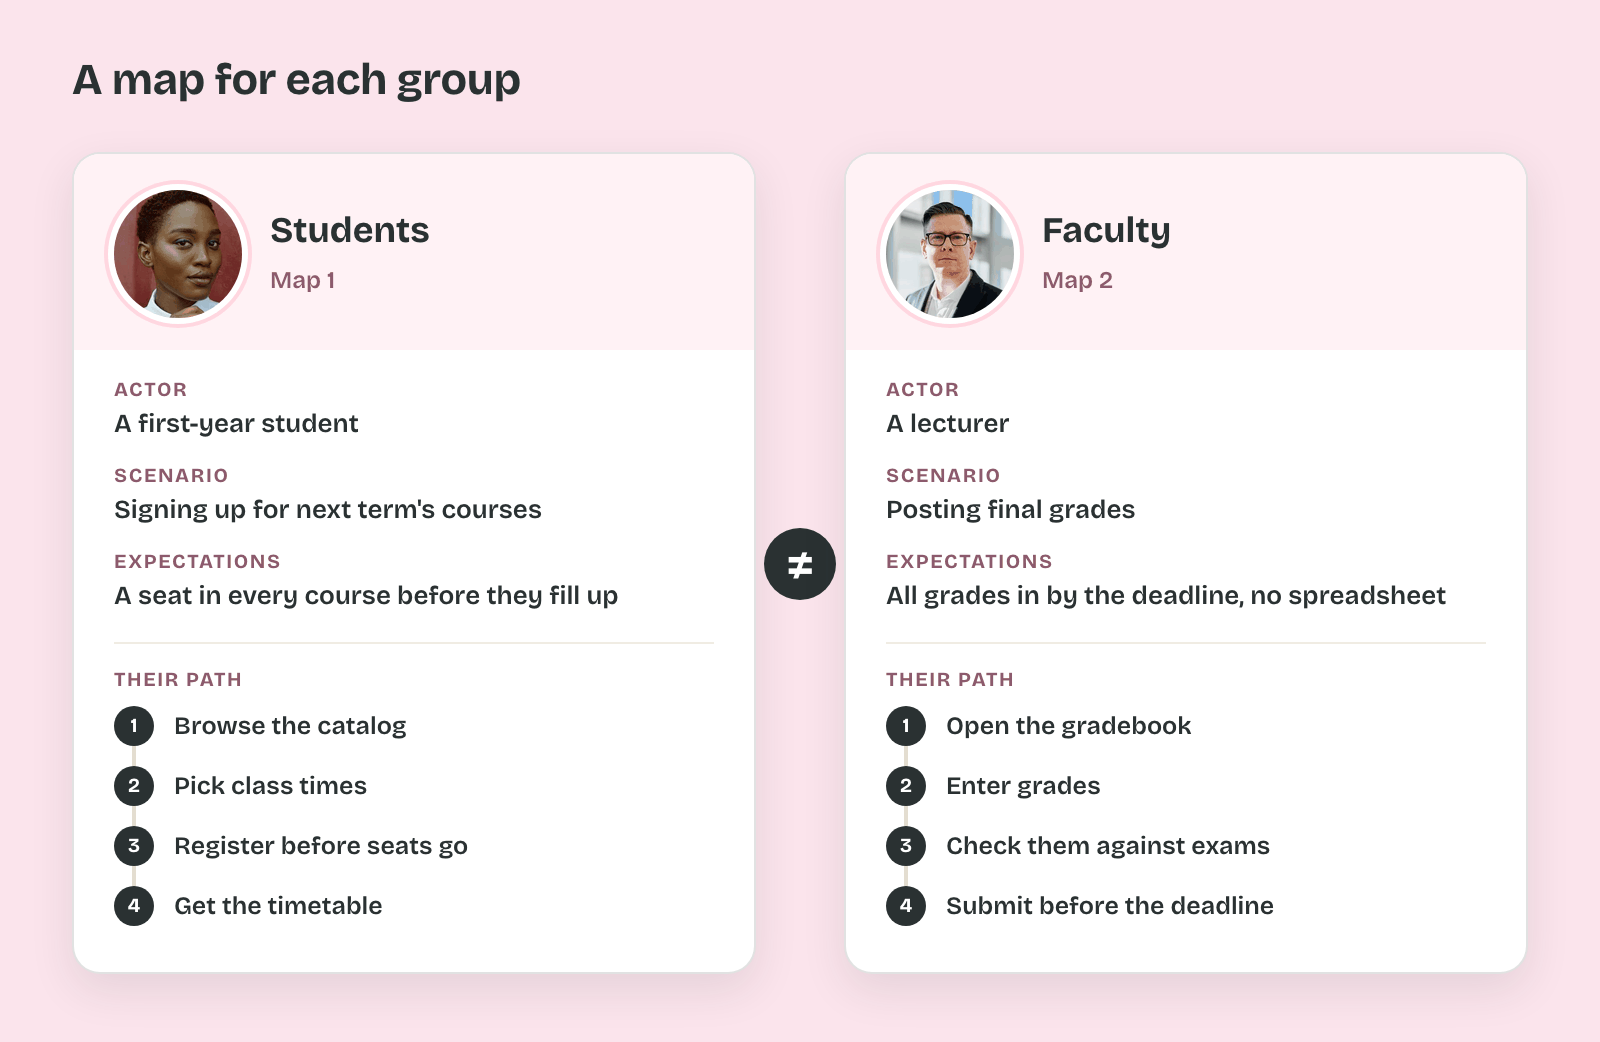
The actor is the one person whose journey the map follows, usually a persona from your research (Personas covers building one). Kaplan's rule is one point of view per map. A university mapping its online portal draws students and faculty separately, because the two groups take different paths for different reasons.
The scenario is the specific situation the map follows, with a clear start and end. "Switching to a cheaper phone plan" is a scenario, while "using our app" is too wide to draw. The scenario also carries the actor's expectations: what they believe will happen, such as finishing in one evening without calling anyone. Those expectations become the yardstick for every low point further down.
The Experience
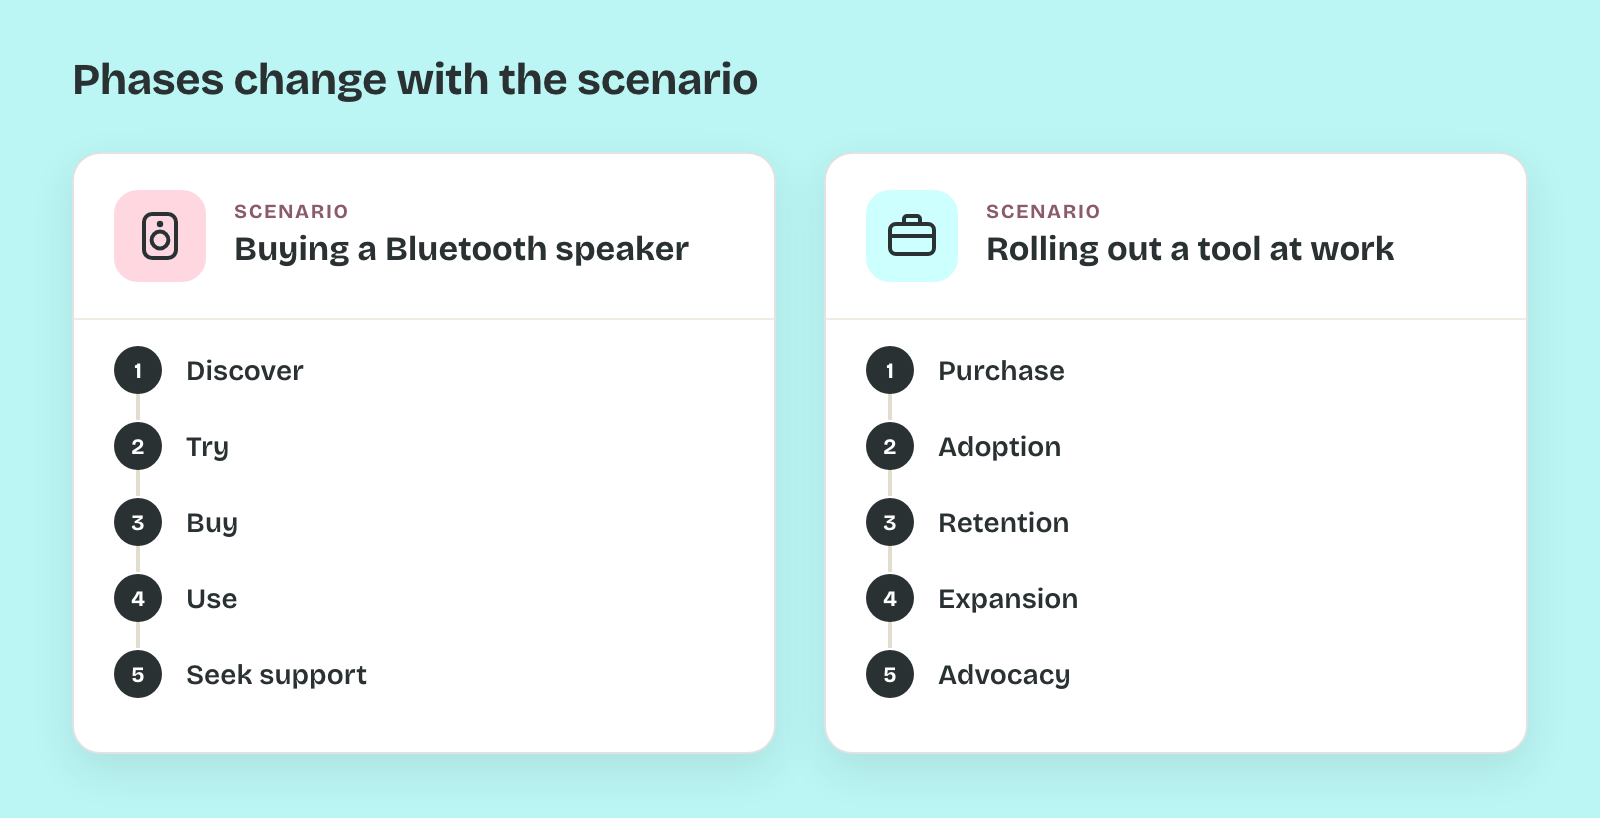
The middle zone tells the story, and phases organize it. A phase is a high-level stage the actor moves through, and the set changes with the scenario.
For example, Gibbons gives discover, try, buy, use, seek support for buying a Bluetooth speaker. For an internal tool rolled out at work she gives purchase, adoption, retention, expansion, advocacy. Adaptive Path's 2011 map for Rail Europe used six phases, from research and planning through to post-travel.
Under each phase sit four rows, which together form the narrative core:
- Goals: what the person is trying to get done in that phase, such as "find out whether my number moves with me".
- Actions: what the person does, in steps you could observe.
- Mindsets: what they think and ask, ideally in their own words from interviews, such as "Will I lose my number if I switch?"
- Emotions: a single line running across all phases, rising at good moments and dropping at bad ones.
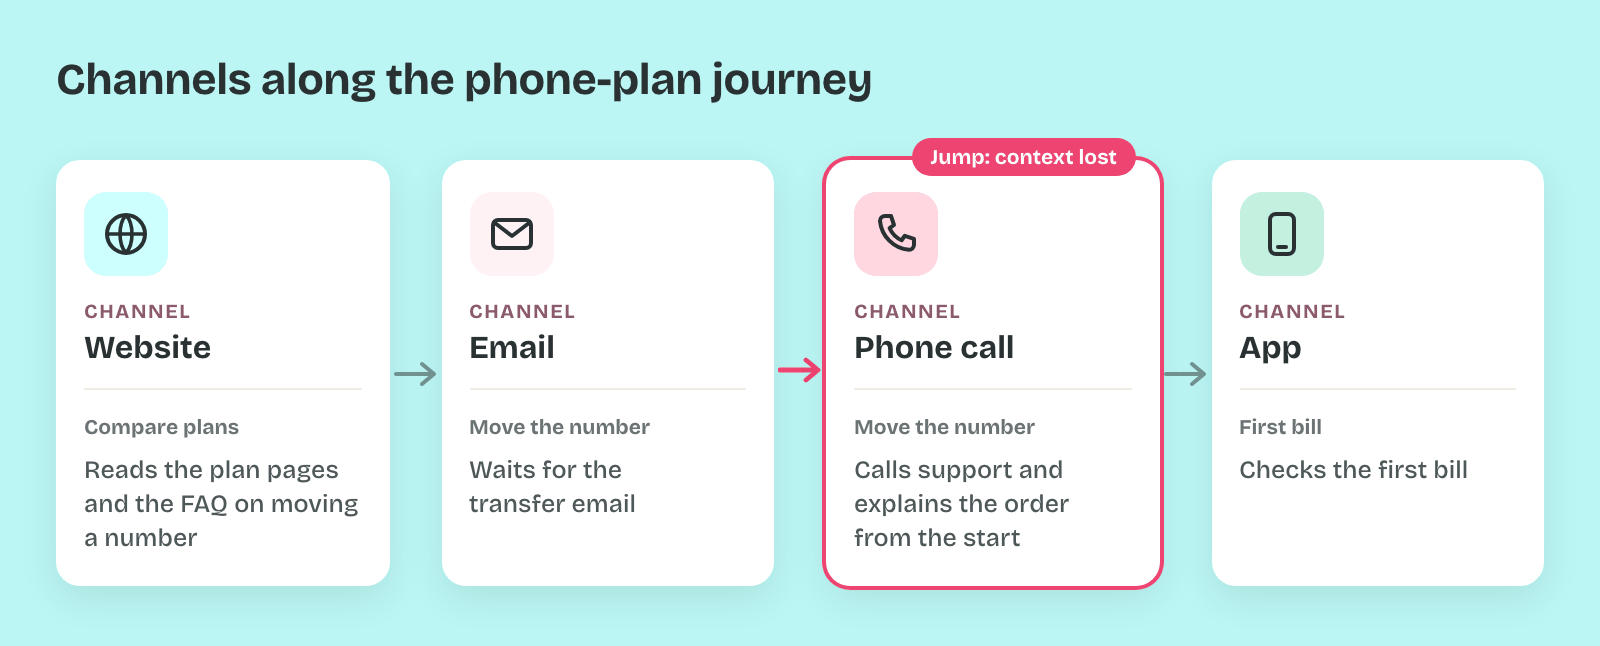
That narrative needs one more row to connect it to the company. Touchpoints are the moments the person interacts with your organization, and channels are the medium for each one: the website, the app, an email, a phone call, a store.
In fact, the idea is older than UX. Jan Carlzon, who ran the airline SAS from 1981, counted about 10 million customers a year. Each met around five employees for about 15 seconds, and Carlzon called each contact a moment of truth.
So plotting channels against phases shows where a person has to jump from the app to an email to a support chat. Every jump is a place where context gets lost.
The Output
Thus the bottom zone turns the story into work. It holds the fifth component, which Gibbons calls opportunities, and it usually splits into three rows:
- Pain points: moments where the experience drops below the expectations set in the lens.
- Opportunities: the improvements those moments suggest, written as a change for the person.
- Owner and metric: the team responsible for each opportunity, with a metric that shows whether it got better.
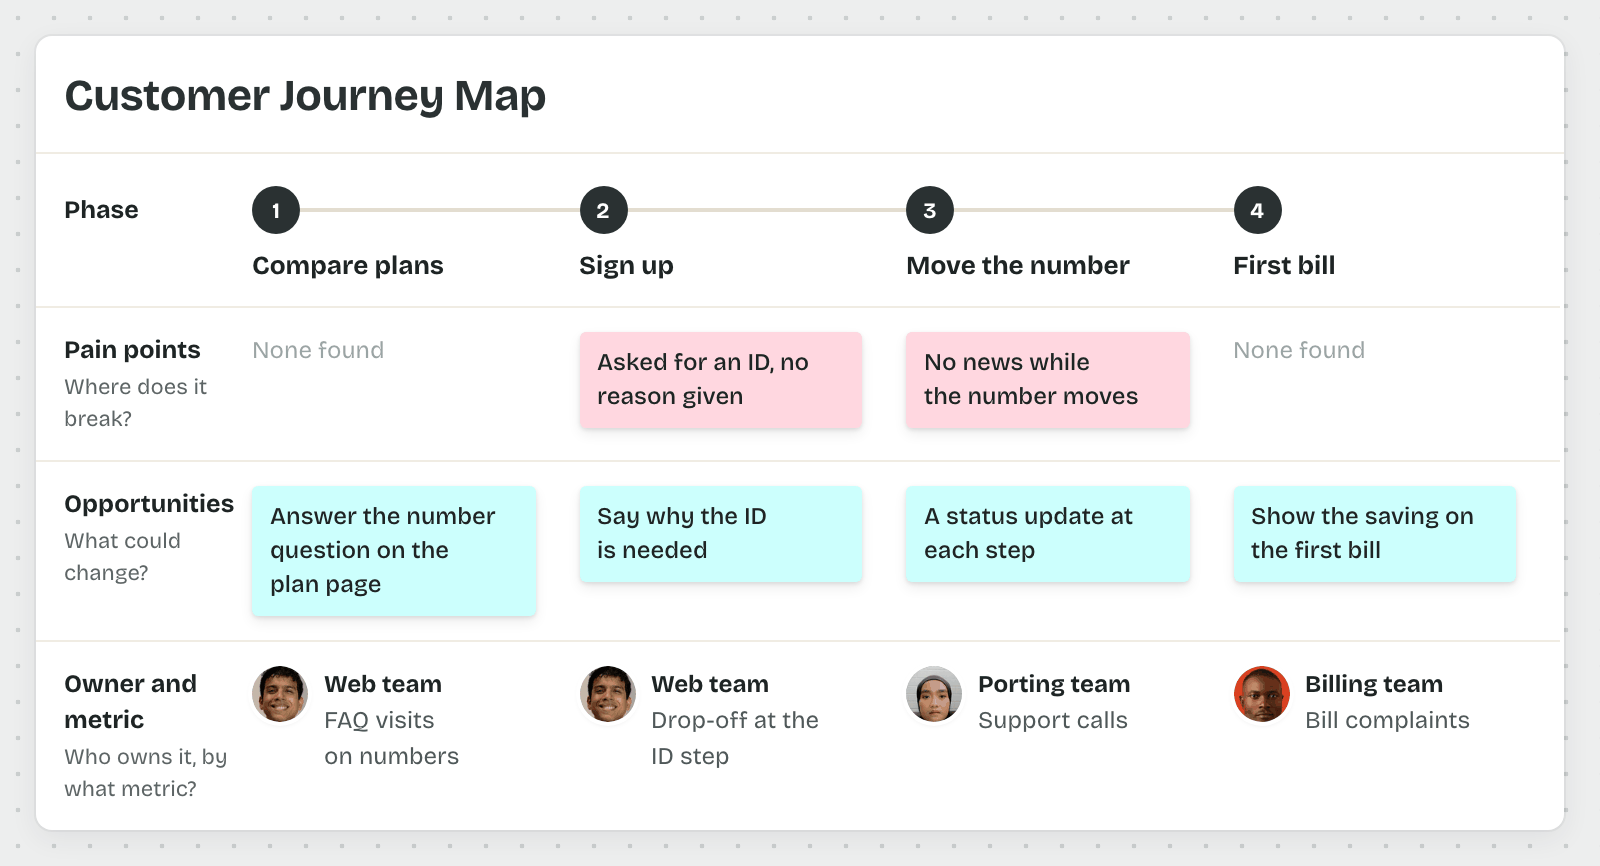
Together, those rows answer the four questions Gibbons sets for this zone: what to do, who owns it, which opportunity is biggest and how to measure it. A map whose bottom zone is empty describes the problem well and changes nothing.
Pro tip: Write the lens as one sentence across the top of the map, for example "Ana, a freelancer, moves her invoices from spreadsheets into our app over one weekend." If the team can't agree on that sentence, the map isn't ready to be drawn.