Dashboards & Data-Heavy UX
An operations lead opens the team dashboard at nine in the morning. Twelve charts load. She looks at two of them, closes the tab, and opens the spreadsheet where she actually works.
Learn on the move: press play and turn your commute, walk or drive into time that grows your design career.
Listen to the full Dashboards & Data-Heavy UX course on DesignPath
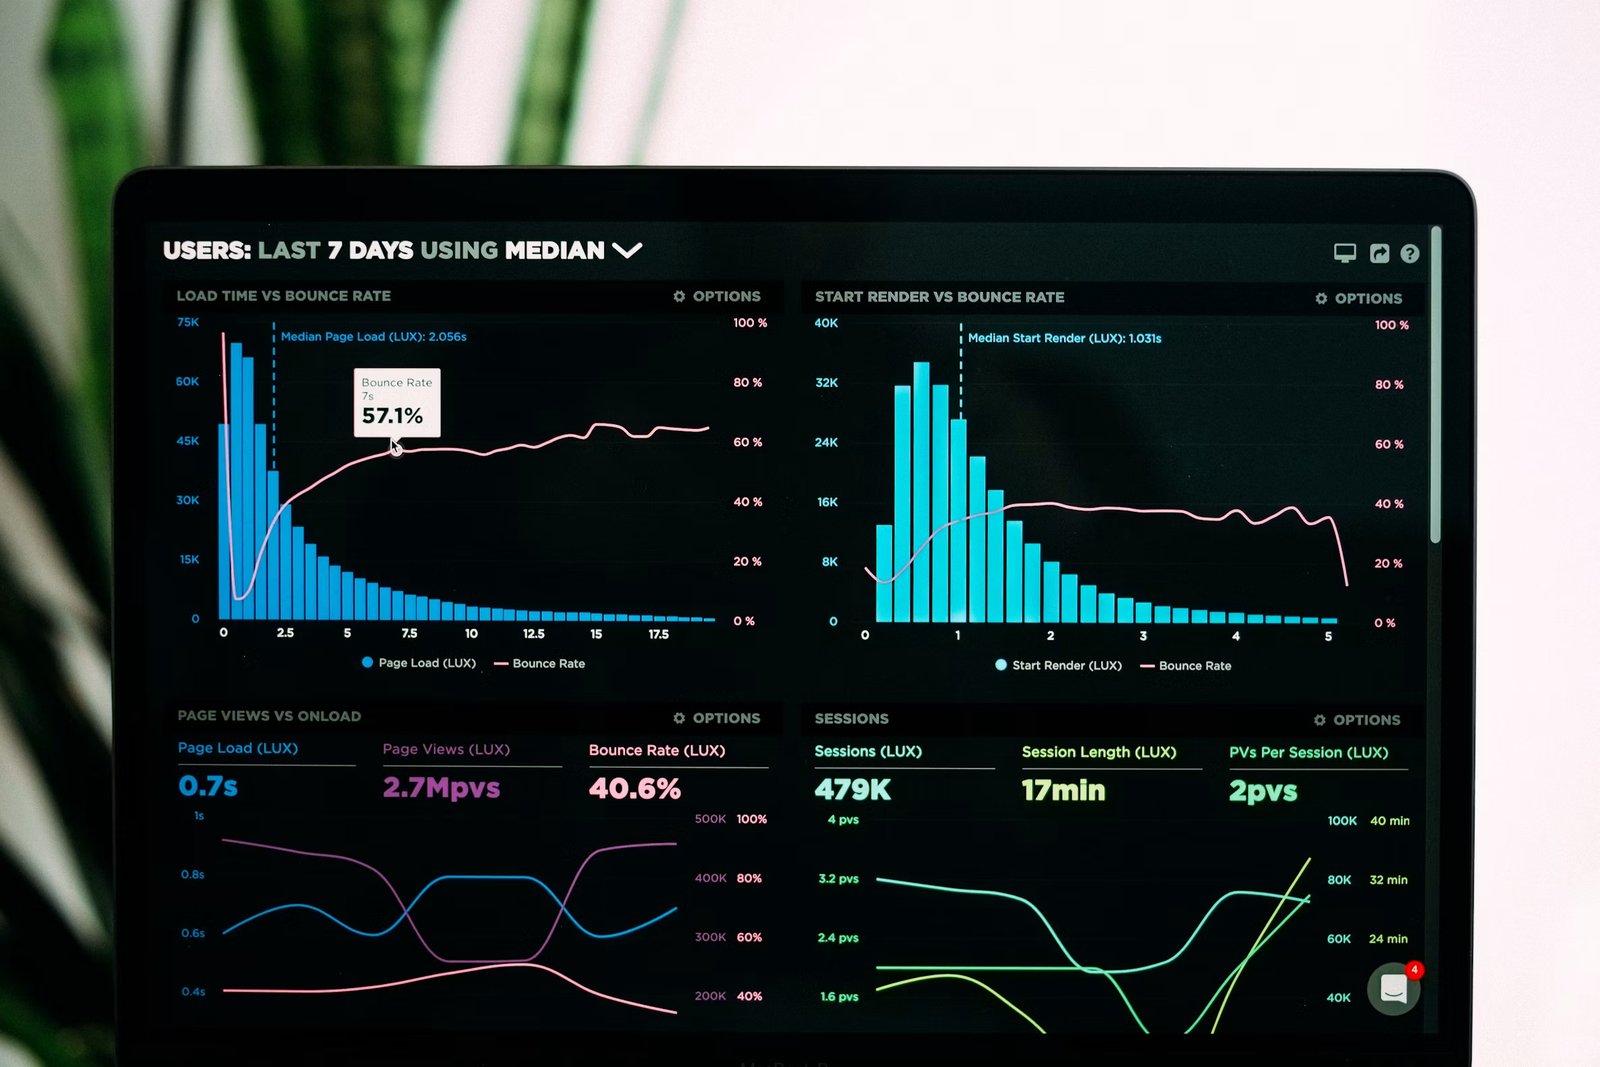
The other ten charts are correct, well built and current. Each was added because somebody asked for it, and none of them has ever changed what anybody did that day.
Stephen Few defines a dashboard as the information needed to achieve specific objectives, arranged on a single screen so it can be monitored at a glance. Almost nothing that gets called a dashboard passes that definition.
What This Domain Changes
Two facts drive the whole module.
The reader has seconds, not minutes.Somebody opens this between other things, usually daily, usually knowing roughly what they expect to see. The design has to answer "is anything wrong" before it answers anything else.
A number alone means nothing.4,182 is not information. Against last week, against the target, against what it was before the change, it becomes information. Most dashboards ship the number and leave the comparison to the reader.
So the patterns you know still apply and their stakes change. Data Tables & Filtering owns the table; here the question is what deserves to be a chart at all. Loading & Skeletons owns waiting; here the wait happens every morning to the same person.
Anatomy of a Dashboard
Open any dashboard, from a hospital bed-management screen to a marketing report, and the same eight components are there or conspicuously absent.
Learning their names is what turns "this feels cluttered" into "there are four tiles with no comparison and no annotation layer".
The Frame
Two parts apply to everything else on the screen, which is why they belong at the top of it.
The time range.The period every figure is measured over. Grafana opens on "Last 6 hours" because it was built for watching systems; Google Analytics opens on a multi-week window because it was built for reporting. Neither is a neutral choice and neither should be hidden.
The segment.Which slice of the data is included: this team, this region, this product line. The time range and the segment together are the sentence the whole screen is answering, and they belong written out in words rather than encoded in a set of dropdowns.
The Measures
Three parts do the actual reporting, and each answers a different question.
The KPI tile answers "what is it now". One number, large, with its unit. On its own it is the least useful component on the screen.
The trend chart answers "which way is it going". The same measure over time, where the shape carries the meaning and the individual points mostly do not.
The breakdown answers "where is it coming from". The same measure split by a dimension, as a bar chart for a handful of categories or a table once there are more than about seven. Data Tables & Filtering owns the table itself.
The Context Layer
Two parts turn a measure into something somebody can act on, and they are the ones most often missing.
The comparison.A previous period, a target, or a normal range drawn behind the line. A tile reading 4,182 with "+12% on last week" is a different object from a tile reading 4,182.
The annotation.A marker on the date something happened: the release, the outage, the campaign. Without it, every team re-derives the same explanation for the same spike, in a meeting, four times a year.
The Exit
The drill-down.The route from a number to the rows behind it. Its absence is what sends people to a spreadsheet, and its presence is what stops the dashboard growing a new chart every time somebody has a question.
The Three-Band Layout
Most working dashboards arrange those parts in three horizontal bands.
The status band at the top carries the frame and three to five KPI tiles with their comparisons. The trend band below it shows how those measures are moving. The detail band at the bottom holds breakdowns and the route into the data.
That order matches how the screen is read: is anything wrong, since when, and where. A dashboard that opens on a breakdown table has put the third question first.
Pro tip: Take a screenshot of your dashboard and label every element with one of the eight names. Anything you cannot label is decoration, and any name that appears nowhere is a question your reader is answering in their head.